AAPL Weekly Technical Analysis: Overbought Momentum Above SMA20/50 with MACD Bullish
Executive Summary
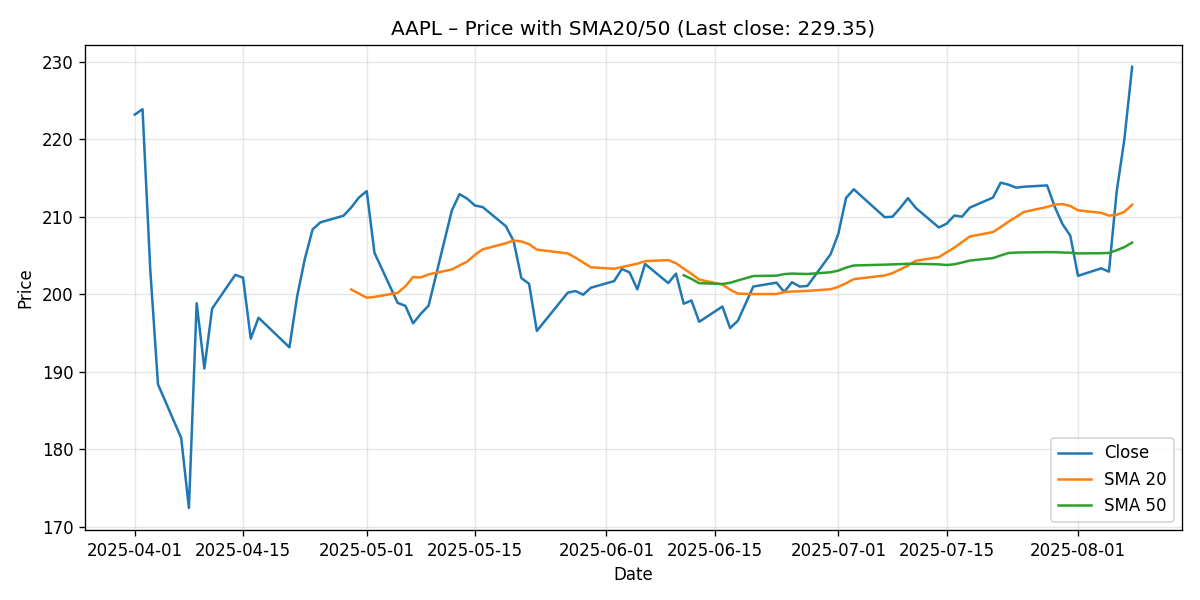
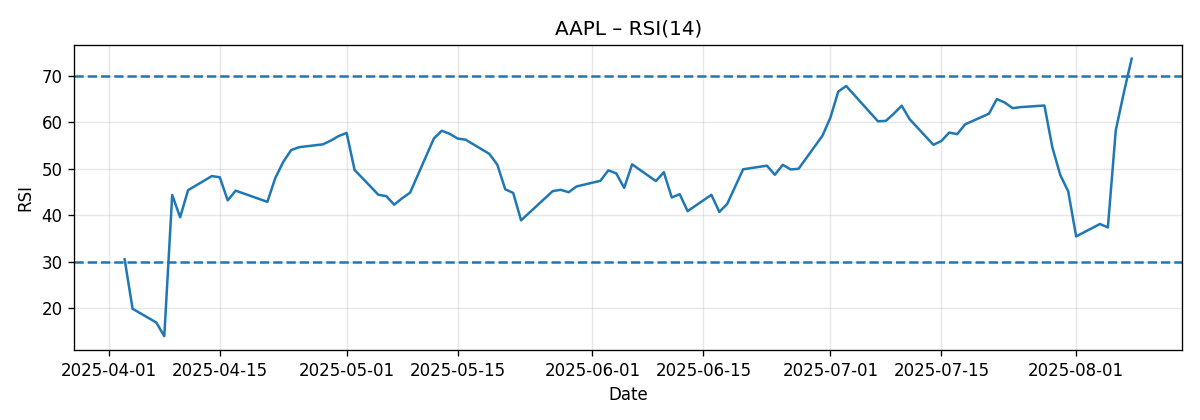
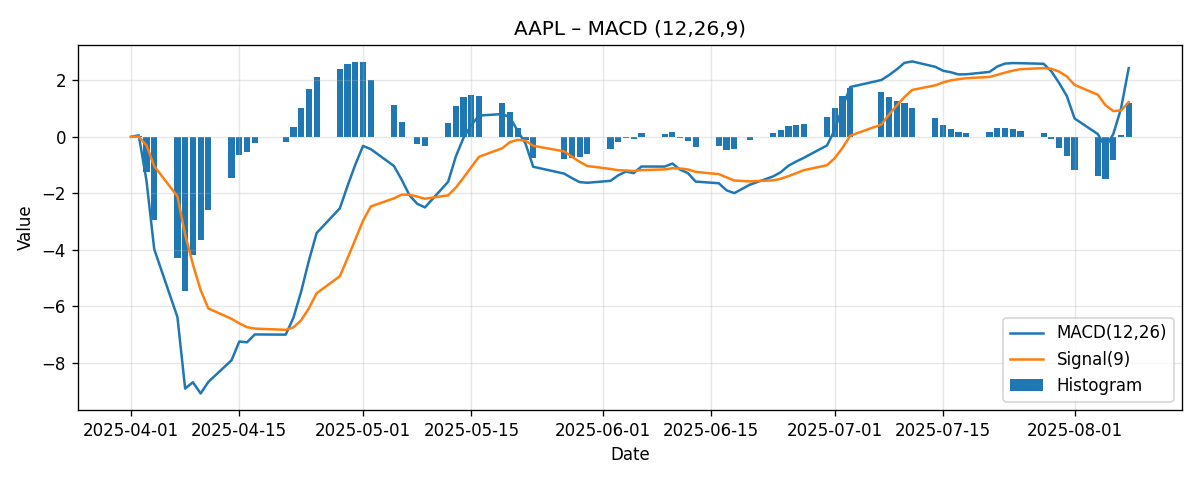
As of the latest snapshot generated on 2025-08-09 13:43 UTC, Apple Inc. (AAPL) closed at 229.35, advancing 10.49% over the past week. The rally propelled price meaningfully above short-term trend gauges: AAPL now sits approximately 8.41% above its 20-day simple moving average (SMA20 ≈ 211.55) and 10.98% above its 50-day simple moving average (SMA50 ≈ 206.67). Momentum indicators confirm the strength of the move: the 14-period Relative Strength Index (RSI14) is at 73.71—firmly in overbought territory—while the MACD (12/26/9) is positive (MACD ≈ 2.43 vs. Signal ≈ 1.23), leaving a bullish histogram of roughly +1.20.
In technical terms, this is a well-sponsored momentum extension in the short run, but it also pushes AAPL into a statistically stretched state relative to its recent mean. That combination often argues for respecting the trend while acknowledging elevated risk of consolidation or a pullback to digest gains. Our base case coming into the next week is a range-bound consolidation with a modest bullish tilt, provided price holds above layered near-term supports around round-number handles and the SMA20. A sustained break above the psychologically important 230 area would keep momentum intact; failure to hold above 225–220 opens room for a mean-reversion test toward the 211.55 SMA20—and, on a deeper fade, the 206.67 SMA50.
- Weekly performance: +10.49%.
- Close: 229.35.
- SMA20: 211.55 (price ≈ +8.41% above).
- SMA50: 206.67 (price ≈ +10.98% above).
- RSI14: 73.71 (overbought).
- MACD (12/26/9): 2.43 vs. Signal 1.23; Histogram ≈ +1.20 (bullish momentum).
Bottom line: The trend is up and momentum is strong, but the setup is stretched. We favor a tactical, risk-managed approach—respecting potential continuation above 230 while preparing for digestion toward 225–220 and, if needed, into the 211–207 zone where the short-term moving averages reside.
Weekly Market Context & Trend
AAPL’s 10.49% advance over a seven-day window reflects a decisive shift toward risk-on behavior in the name. The thrust carried the stock well beyond nearby moving-average measures of trend (SMA20 and SMA50), underscoring the vigor of buying pressure in the period. Typically, when price accelerates this far above its short-term moving averages, the market is signaling a powerful short-term demand imbalance. In such cases, traders often encounter two competing realities:
- Strong-trend continuity: Positive feedback loops can keep price elevated and even drive continued upside runs, particularly when momentum gauges (e.g., MACD) remain supportive.
- Mean reversion risk: Overbought readings on oscillators like RSI often precede consolidations or pullbacks as the market digests gains and re-equilibrates closer to the moving averages.
With AAPL perched more than 8% above the SMA20 and nearly 11% above the SMA50, both realities are immediately relevant. For trend followers, the challenge is to ride the move without overstaying as the risk of a shakeout rises. For mean-reversion traders, the challenge is to avoid fighting strength too early while waiting for evidence of waning momentum (for instance, an MACD histogram contraction or relative weakness around round-number levels).
In the week ahead, we expect participants to focus on whether AAPL can quickly establish acceptance above the 230 area (a round-number region just above the latest close) or whether supply emerges that nudges price back toward 225 and 220. The emerging balance between those two zones will likely set the tone for the next impulse: continuation toward higher psychological levels if buyers dominate, or a digestion phase that bleeds off overbought conditions if sellers press their advantage.
Detailed Technicals (Price, SMA20/50, RSI14, MACD 12/26/9)
Price Structure vs. Moving Averages (SMA20/50)
Price closed at 229.35, well above the SMA20 (211.55) and SMA50 (206.67). The distances—approximately +8.41% vs. the SMA20 and +10.98% vs. the SMA50—testify to the amplitude of this week’s advance. In trend analysis, reclaiming and extending beyond these moving averages often marks a positive inflection. However, such extensions can leave price vulnerable to countertrend moves as profit-taking rises and new buyers become more selective.
What this means tactically:
- First layer of dynamic support: SMA20 at 211.55. In strong trends, shallow pullbacks often attempt to stabilize near the 20-day average.
- Secondary layer of dynamic support: SMA50 at 206.67. A break of the SMA20 does not, by itself, terminate a maturing uptrend; the 50-day average often represents a deeper trend “defense” line.
- Immediate focal area: the 230 round-number region. Trading behavior around this figure (acceptance versus rejection) could dictate whether momentum carries forward or pauses.
Given this configuration, a constructive sequence would feature shallow dips getting absorbed above 220–225, followed by a decisive drive and hold above 230. Less constructive would be immediate rejection into the mid-220s, followed by a daily close below 220 that invites a more thorough mean reversion toward the SMA20.
RSI14 (Momentum/Overbought)
The RSI14 sits at 73.71, above the classic 70 threshold that often defines overbought conditions. Overbought is not inherently bearish—it simply signals that gains have come quickly. In very strong trends, RSI can remain overbought for extended periods as price “rises along the right edge” of the chart. However, overbought conditions do increase the probability of two potential developments:
- Consolidation: Sideways movement that allows momentum to normalize without major price damage.
- Pullback: A retracement to, or toward, short-term averages that relieves overextension.
Because AAPL’s weekly move was large in percentage terms and the RSI is clearly elevated, we assign higher-than-normal odds to a digestion phase—either as range trade (e.g., oscillating around the high-220s to low-230s) or as a measured pullback into 225–220. From a risk-management perspective, overbought RSI counsels against chasing strength without a plan; it also suggests that bulls consider staggered entries on dips where structure supports the trend, rather than pressing highs indiscriminately.
MACD 12/26/9 (Trend-Momentum)
The MACD line at approximately 2.43 sits above its signal line at approximately 1.23, leaving a positive histogram near +1.20. This configuration is the textbook definition of a short-term momentum uptrend: the spread between MACD and its signal line implies ongoing upside pressure on the timeframe being observed.
Two practical notes follow from this setup:
- As long as the MACD line stays above the signal line, dips are often framed as temporary within the active upswing.
- Watch for histogram compression (a narrowing of the gap) as an early hint that momentum is moderating. If price hesitates near round-number resistance and the histogram shrinks, a consolidation or pullback becomes more probable.
At present, the MACD favors further upside attempts, especially if price can hold above mid-to-high 220s and break cleanly over 230. Should downside pressure emerge, initial momentum warnings would likely appear as histogram contraction, followed by a flattening and potential crossover on further weakness.
Key Levels (Support/Resistance)
The following table organizes notable near-term price reference points derived from the snapshot data (moving averages) and common psychological round numbers that traders often respect. Levels are approximations and should be used as zones rather than exact ticks.
| Level Type | Price | Comment |
|---|---|---|
| Last Close | 229.35 | Weekly finish after a +10.49% gain |
| Immediate Resistance | 230.00 | Psychological round-number area just above the close |
| Next Resistance | 235.00 | Psychological level; potential objective on continuation |
| Stretch Resistance | 238.00 | Upper extension zone if momentum stays firm next week |
| Initial Support | 225.00 | Psychological level; first cushion if 230 rejects |
| Near-Term Support | 220.00 | Psychological level; stronger cushion within recent upswing |
| Dynamic Support (SMA20) | 211.55 | First moving-average defense in a strong trend |
| Secondary Dynamic Support (SMA50) | 206.67 | Deeper trend support on further mean reversion |
| Psychological Line in the Sand | 200.00 | Big round number often watched by longer-horizon participants |
Scenario Analysis: Bullish, Bearish, and Most-Likely (Next Week Projections)
With the current readings—price extended above the SMAs, RSI overbought, and MACD supportive—several pathways present themselves. We frame them as discrete scenarios with concrete triggers, invalidations, and numerical projections for the coming week. Note that these are tactical ranges, not long-term targets.
Bullish Continuation
- Trigger: A decisive intraday break and daily close above 230 that then holds on retests.
- Momentum Context: MACD remains firmly above signal; histogram stays positive. RSI can remain elevated in a trending move.
- Projection (next week): 232.00 to 238.00.
- Path: Acceptance above 230 invites probing higher psychological steps (e.g., toward 235, then 238). Shallow intraday dips should find demand above 230–231 if the breakout is healthy.
- Invalidation for the week: A failed breakout that loses 230 and subsequently closes below 225 would reduce the odds of immediate continuation.
Bearish Mean Reversion
- Trigger: Rejection below 230 followed by a daily close beneath 225, coupled with visible momentum cooling (MACD histogram contraction).
- Momentum Context: RSI retreats from overbought; MACD spread narrows.
- Projection (next week): 218.00 to 212.00, with an outside chance of 208.00 if selling accelerates.
- Path: Once below 225, sellers may test the 220 region. A sustained break there shifts focus to the SMA20 at 211.55. If risk-off conditions emerge, the SMA50 around 206.67 becomes a secondary magnet, though that deeper move is a lower-probability extension for a single week absent a strong catalyst.
- Invalidation for the week: A swift reclaim of 230 that holds into the close would neutralize the immediate mean-reversion call.
Most-Likely: Consolidation with Bullish Bias
- Trigger: Failure to cleanly clear 230 paired with strong dip buying above 225–220.
- Momentum Context: RSI drifts down toward the high-60s without breaking; MACD remains above the signal but the histogram compresses.
- Projection (next week): 224.00 to 236.00.
- Path: Price oscillates around upper-220s/low-230s as the market absorbs recent gains. Dips toward 225–220 are bought, while overhead supply appears near 235–236 until stronger catalysts arrive.
- Invalidation for the week: A daily close below 220 would shift the balance toward the bearish scenario; a strong break and hold above 230 with expanding momentum would transition toward the bullish continuation case.
Comparative Outlook: External Predictions and Our Take
We compare our tactical, one-week technical outlook with three external predictions, each providing longer-horizon targets or strategic positioning. These references are useful context, though they operate on different timeframes than our weekly setup.
1) BofA Securities via Barron’s
Source: Barron’s
“BofA Securities analyst Wamsi Mohan raised Apple’s price target to $250.”
Our view: A $250 target sits above the current price by a modest margin, implicitly supportive of continued strength. From a near-term technical standpoint, our work does not explicitly target $250 for the coming week; rather, we map incremental steps (230 → 235 → 238) and let momentum and structure confirm each rung. We align with the positive directional bias implied by the target insofar as MACD is bullish and price is comfortably above SMA20/50. However, we diverge on timing: with RSI overbought at 73.71 and price already 8–11% above short-term SMAs, we see a higher probability of consolidation before sustained attempts at higher objectives.
2) Wedbush via Barron’s
Source: Barron’s
“Wedbush maintained an Outperform rating with a $270 stock target.”
Our view: The $270 target denotes a more ambitious upside trajectory relative to current price. On a weekly tactical horizon, we are not projecting that kind of extension. The technicals, while bullish, are also stretched, making a measured, staircase-like approach more plausible than a straight-line surge. We align with the broader positive narrative to the extent that trend and momentum are currently favorable; we differ in cadence and scope, emphasizing risk-managed progression through nearby levels rather than extrapolating a direct path to much higher targets within a week.
3) Melius Research via Investor’s Business Daily
Source: Investor’s Business Daily
“Melius Research raised its price target to $260.”
Our view: As with the other targets, $260 underscores constructive sentiment. The near-term technicals corroborate a favorable backdrop—positive MACD, price above SMAs—but the overbought RSI argues for patience. Our approach is to respect momentum while letting the stock prove acceptance above 230 and then 235. If it can do that with momentum support, higher targets become progressively more credible. In short, we align directionally but maintain a more granular, level-by-level roadmap for the coming week.
Risk Factors & What Could Invalidate the Setups
Technical setups are inherently probabilistic. Below are conditions that could complicate or invalidate our scenarios, along with how we would interpret them:
Technical Invalidation Triggers
- Daily close below 220: This would challenge the consolidation-bullish-bias case and put the mean-reversion scenario at the forefront, increasing odds of a test of the 211.55 SMA20.
- Loss of the SMA20 (≈ 211.55): A decisive break and failure to reclaim the SMA20 would warn that the short-term uptrend is faltering, refocusing attention on the SMA50 (≈ 206.67).
- Loss of the SMA50 (≈ 206.67): A close below the 50-day average would be a more material setback, implying a larger corrective phase is underway rather than a routine digestion.
- MACD bear cross: Should the MACD line drop below the signal line, especially while price is losing successive supports, it would confirm momentum rollover and favor defensive positioning.
- RSI failure to recover above 50 after pullbacks: If RSI plunges from overbought and then cannot rebound above the midline on bounces, it typically signals a transition from uptrend to range or downtrend on the observed timeframe.
Event, Headline, and Macro Risks
- Policy and geopolitical headlines: Sudden shifts in trade, tariffs, or regulatory posture can trigger outsized moves and gap risk that overwhelm nearby technical levels.
- Company-specific news flow: Product cycle updates, supply chain commentary, or strategic announcements can amplify volatility and invalidate short-term technical expectations, positively or negatively.
- Market-wide risk appetite: Changes in broader risk sentiment—whether from macroeconomic data or sector rotation—can alter the demand/supply balance for mega-cap technology names in a way that reduces the reliability of local levels.
Given these risks, traders should size positions appropriately and predefine exit criteria. Technical levels are guideposts, not guarantees; decisive news can produce price gaps through those levels without tradable retests.
Tactical Playbook for Different Participant Types
While our scenarios describe the broad landscape, application can differ across trading styles. The following considerations are intended to help map the same technical picture to different tactical needs.
- Momentum traders: Look for clean acceptance above 230 with expanding intraday participation. Tight risk can be placed just below the breakout trigger (e.g., a small buffer under 230) with trailing stops employed if price pushes toward 235–238. If momentum stalls and the breakout fails, exit swiftly.
- Mean-reversion traders: Patience often pays after a +10% week. Consider monitoring 225 and 220 for signs of stabilization (e.g., higher lows on intraday retests) before entry. Avoid stepping in front of accelerating downside; wait for momentum to compress (e.g., MACD histogram narrowing) and for buyers to prove they can defend a level.
- Position traders: If already long from lower levels (near the SMAs), consider partial de-risking into strength or employing stops that lock in gains while preserving upside optionality. New position entries on a weekly horizon may find better risk/reward on dips unless the 230 area is convincingly converted into support.
Putting It All Together
The present AAPL configuration is a classic push/pull: trend and momentum strongly support the bull case, but overbought readings and distance from key moving averages warn against complacency. Rather than adopting a binary stance, we advocate a conditional approach:
- If AAPL holds above 230 and builds value there, expect a measured push toward 235–238.
- If AAPL fails near 230 and slips below 225, brace for a test of 220; below 220, the SMA20 at 211.55 becomes the focal magnet for mean reversion.
- Throughout, track the MACD histogram and RSI behavior for early tells of momentum preservation or decay.
Because the stock is already elevated versus SMA20/50, the marginal buyer’s enthusiasm may ebb and flow quickly with intraday headlines and market tone. Tactical flexibility—being willing to pivot between breakout and fade tactics as evidence changes—will likely be rewarded in the week ahead.
Data Recap (For Reference)
- Ticker: AAPL
- Snapshot time: 2025-08-09 13:43 UTC
- Last close: 229.35
- Weekly change: +10.49%
- SMA20: 211.55
- SMA50: 206.67
- RSI14: 73.71
- MACD: 2.43
- MACD Signal: 1.23
- MACD Histogram: ≈ +1.20
Editorial Statement
This analysis is a technical review based solely on the supplied snapshot data (last close, week-over-week change, SMA20, SMA50, RSI14, and MACD 12/26/9) and the three external references cited above. It is designed for educational purposes and does not incorporate fundamental valuation, earnings forecasts, or undisclosed market information. Markets carry risk, and short-term outcomes can differ materially from expectations—especially around news events or broader shifts in risk appetite.
Nothing herein is investment advice, an offer, or a recommendation to buy or sell any security. You are solely responsible for your trading and investment decisions. Consider your financial objectives, risk tolerance, and, if needed, consult a qualified financial professional before acting. Past performance and technical patterns are not guarantees of future results.
Conclusion
AAPL heads into the new week with a clear tailwind: an emphatic weekly gain, price above short-term averages, and a supportive MACD structure. The caveat is equally clear: RSI is overbought, and price is stretched versus its mean. In this tension, we expect the market to test the mettle of both breakout buyers and would-be dip buyers. Our base case calls for a controlled range with a bullish lean—224 to 236—so long as 220 holds on closing basis. A clean acceptance above 230 would open incremental upside steps toward 235 and potentially 238, whereas a loss of 225 and then 220 would tilt the week toward mean reversion with the SMA20 and SMA50 as downside magnets.
In short: Respect the trend, plan for digestion, and let the market reveal whether 230 becomes a floor or a ceiling in the days ahead.