Microsoft (MSFT) Weekly Technical Analysis: Uptrend Intact Above Key Moving Averages, While Momentum Softens Into Next Week
Executive Summary
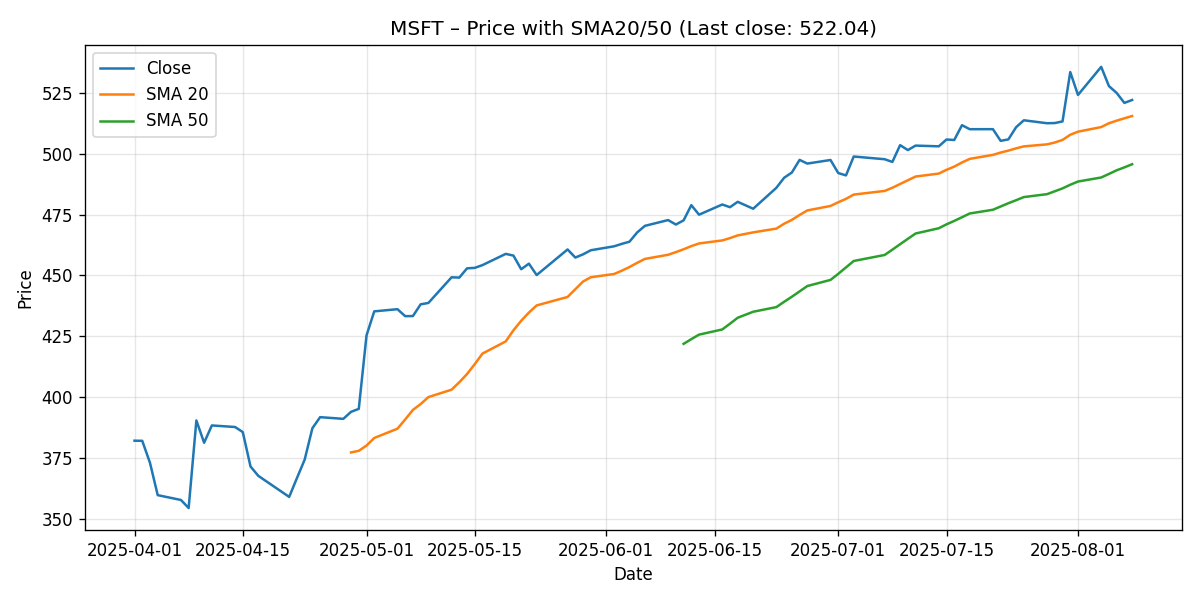
Microsoft (MSFT) finished the latest 7-day window at 522.04, down 2.15% week over week. Despite the pullback, price remains above both the 20-day and 50-day simple moving averages (SMAs), with SMA20 at 515.46 and SMA50 at 495.68. The RSI(14) sits at 59.71—constructively bullish without being overbought—while the MACD(12,26,9) line at 9.08 is below its signal at 9.72, leaving the histogram slightly negative and signaling modest momentum fatigue.
- Close (last): 522.04
- Week change: -2.15%
- SMA20: 515.46; SMA50: 495.68 (price above both)
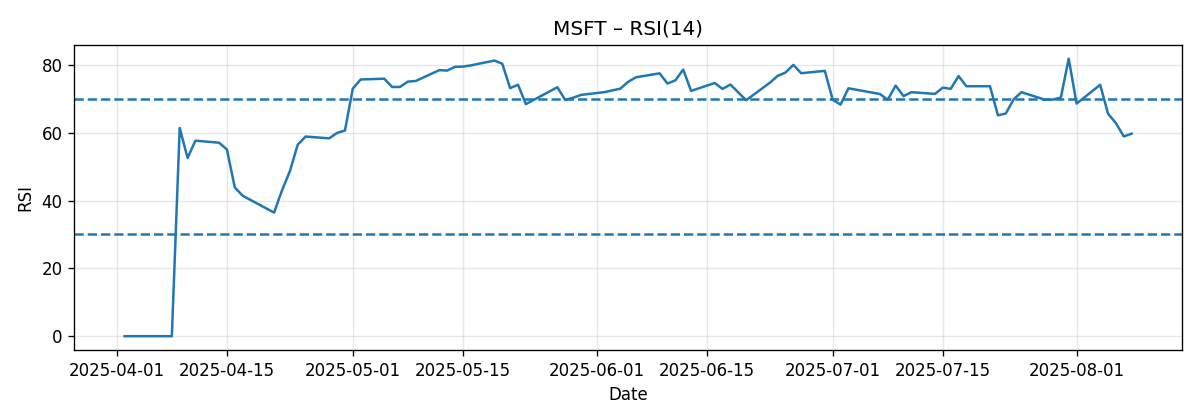
- RSI(14): 59.71 (positive bias, not overbought)
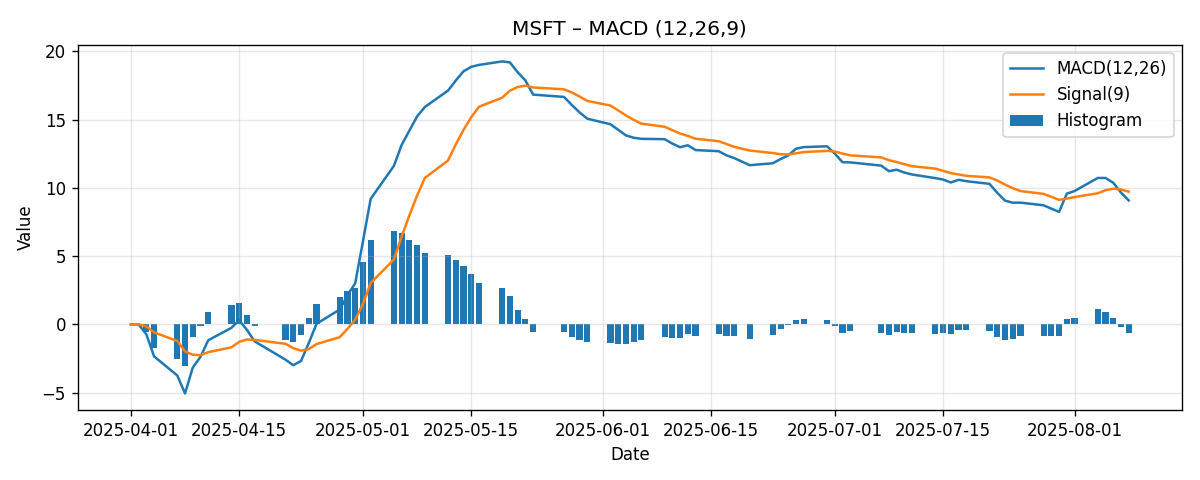
- MACD line: 9.08; Signal: 9.72 (MACD histogram negative)
Overall, MSFT maintains a medium-term uptrend, evidenced by price > SMA20 > SMA50, while short-term momentum indicators suggest a pause or consolidation. For the week ahead, we frame scenarios around a psychological pivot at 520 and resistance near 530 and 540. Options-based commentary cited externally suggests about a 4% expected move by week’s end, translating to a statistical range near 500–543 from the current price. Our base case favors range trading between roughly 512 and 536 unless a decisive break unfolds.
Weekly Market Context & Trend
Across the last seven sessions, MSFT gave back 2.15%. That dip comes after sustained strength that kept price above the 20-day and 50-day moving averages. The sequence—price above SMA20, and SMA20 above SMA50—supports the view that the intermediate trend structure remains bullish, even as near-term momentum has cooled.
In practice, pullbacks within intact uptrends commonly gravitate toward fast moving averages. Here, the SMA20 at 515.46 is a logical near-term reference level for dip buyers to defend. A clean close below that average would be the first structural warning that momentum is shifting from “pause” to something more corrective toward the SMA50 around 495.68. Conversely, a push and close back above 530 would indicate that dip demand remains healthy and could set up a retest of the 540 area next.
Visualizing the trend through price and moving averages:
Detailed Technicals (Price + SMA20/50, RSI14, MACD 12/26/9)
Price Action vs. SMA20 and SMA50
The closing print at 522.04 keeps MSFT above both trend gauges:
- Price: 522.04
- SMA20: 515.46
- SMA50: 495.68
Implications:
- Medium-term trend: Positive. Price is above the 20- and 50-day averages, and the 20-day average itself is above the 50-day, indicating the trend remains constructive.
- Immediate test: 515.46 (SMA20) is a natural line in the sand for buyers. As long as price respects that zone on closing basis, the uptrend framework is intact.
- Deeper mean reversion: A decisive loss of the 515.46 area opens risk of a deeper pullback toward 510 and then 500–496, where the SMA50 (495.68) offers the next structural support.
RSI(14)
RSI(14) reads 59.71—an upper-neutral to bullish reading that reflects underlying demand without signaling overbought conditions.
- RSI near 60 is consistent with an uptrend that is consolidating rather than reversing.
- If RSI dips sustainably below 50, it would warn that bears are gaining incremental control, often accompanying a test of the next lower moving average.
- If RSI drives above 65–70 on a breakout, it would confirm re-acceleration in the prevailing trend.
MACD (12/26/9)
The MACD line is at 9.08 versus the signal line at 9.72, leaving a slightly negative histogram. In practice, that indicates that upside momentum has eased relative to recent weeks.
- MACD line: 9.08
- Signal line: 9.72
- Histogram: negative (MACD below Signal)
Interpretation:
- Momentum cool-down: The negative histogram aligns with the modest price pullback this week.
- Watch for a turn: If the histogram begins to rise toward zero and crosses positive, it often precedes or confirms attempts to push higher.
- Risk marker: A further expansion of the negative histogram into next week would keep the bias toward consolidation or a test of the SMA20 and potentially deeper supports.
Key Levels (Support/Resistance)
We concentrate on levels that are derived from the provided moving averages and common psychological reference points. These are not claims about prior highs/lows but pragmatic zones traders often respect in the absence of new catalysts.
| Level | Type | Reference | Why it matters | What confirms/invalidates |
|---|---|---|---|---|
| 540 | Resistance (R2) | Psychological/round | Upper magnet if momentum returns; aligns with a well-watched round number. | Close above 540 tilts toward trend re-acceleration; repeated rejections keep the range intact. |
| 530 | Resistance (R1) | Psychological/near-term pivot | First upside test above current price; a clearance often prompts short-term follow-through. | Daily close above 530 improves odds of 535–540 test. |
| 522 | Spot price | Latest close | Reference anchor for week-ahead scenarios. | Holding above 520 supports a neutral-to-bullish stance; loss of 520 shifts focus to SMA20. |
| 520 | Support (S1) | Psychological/round | Immediate nearby support; a frequent intraday pivot. | Clean break below 520 opens room to 515–516 (SMA20 area). |
| 515.46 | Support (S2) | SMA20 | Primary dynamic support in an ongoing uptrend. | Close below SMA20 warns of deeper pullback; reclaiming it restores near-term confidence. |
| 510 | Support (S3) | Psychological/round | Intermediate cushion if SMA20 fails. | Failure to hold 510 puts 500 in play. |
| 500 | Support (S4) | Psychological/round | Major psychological level; typical target in a 4% weekly swing. | Decisive break below 500 would challenge the medium-term uptrend. |
| 495.68 | Support (S5) | SMA50 | Deeper mean reversion threshold in trending markets. | Holding the 50-day keeps the bigger-picture trend constructive; loss of it would be a notable warning. |
Scenario Analysis (Bullish / Bearish / Most-Likely)
We anchor our scenarios to the provided technicals and an externally cited options-based expectation for roughly a 4% swing by week’s end from around 522, implying a statistical range of approximately 500–543. Within that envelope, triggers around 520/515 (support) and 530/540 (resistance) set the tactical path.
Bullish Scenario
- Trigger: A sustained move and daily close above 530.
- Technical rationale: Price already sits above SMA20 and SMA50; RSI is supportive without being overbought. A reclaim of 530 would likely turn the MACD histogram toward neutral-to-positive as momentum rebuilds.
- Projected range (next week): 532–545, with interim pauses near 535 and 540.
- Invalidation: Failure to hold 520 after a breakout attempt, or a quick reversal that closes back below 530, would neutralize the immediate bullish thrust.
Bearish Scenario
- Trigger: Daily close below 515.46 (SMA20), followed by failure to recover that level on a retest.
- Technical rationale: The MACD histogram is already negative, indicating momentum softness. A break of SMA20 would open a path to 510 and then the 500–496 area (SMA50 at 495.68) if pressure persists.
- Projected range (next week): 498–515, with potential extension to 495 if 500 fails on closing basis.
- Invalidation: Swift recovery back above 520–522 and especially 530 would cancel the bearish pressure and reinstate a range or bullish bias.
Most-Likely (Base Case) Scenario
- Setup: Range-bound consolidation as momentum cools but the trend framework holds.
- Technical rationale: Price above SMA20 and SMA50 with RSI near 60 favors buying dips, while a slightly negative MACD histogram argues for capped upside until momentum re-accelerates.
- Projected range (next week): 512–536, with outlier tests toward 510 on dips and 540 on rallies if headlines intrude.
- Key watchpoints: Reactions at 520 (intraday pivot) and at 530 (first resistance) will likely dictate whether the range expands or contracts.
Comparative Outlook: External Predictions vs. Our View
We align our analysis with three external references and explain where we concur or differ, using only the provided quotations and links.
1) Investing.com (Technical Bias)
Source: Investing.com — MSFT Technical Analysis
“Based on moving averages and other technical indicators, the daily buy/sell signal is Strong Buy.”
Our take: On a pure trend basis, we partially agree. MSFT trades above SMA20 and SMA50, and the SMA20 itself is above SMA50—consistent with a bullish structure. Where we are more measured is the short-term momentum: the MACD line below its signal and a negative histogram indicate that while the broader uptrend is intact, the immediate impulse has cooled. Thus, we categorize the current setup as bullish structure with near-term consolidation risk, rather than an unqualified “Strong Buy” over the next few sessions. A close back above 530 that turns the MACD histogram upward would bring our near-term stance closer to that verdict.
2) Investopedia (Options-Implied Weekly Move)
Source: Investopedia — What Traders Expect After Earnings
“Options pricing indicates an expected share price fluctuation of around 4% by the end of the week.”
Our take: This statistical frame (≈±4%) fits well with our scenario boundaries. From the 522 area, ±4% implies roughly 500–543. We use that as a volatility envelope and then refine with technical inflection points: 515.46 (SMA20) and 530/540 (round-number resistances). Our base-case 512–536 range sits inside the implied band, reflecting the interplay between supportive trend structure and soft near-term momentum. If a catalyst emerges, price could traverse the full implied span toward 500 or 543.
3) MarketWatch (Analyst Upgrade and 12-month Target)
Source: MarketWatch — Analyst Upgrade
“Oppenheimer upgraded Microsoft to ‘outperform’ and set a $600 price target, about 20% above the recent close.”
Our take: We view this as a strategic, not tactical, signal. A $600 target speaks to a 12-month horizon and fundamental drivers (e.g., AI and cloud) that can outweigh short-term technical noise. Our weekly technicals neither confirm nor deny a path to 600; they simply suggest that, on a one-week basis, MSFT is likely to oscillate within the 500–543 statistical band unless it decisively clears 530–540. In short, we can respect the long-term constructive thesis while still expecting near-term consolidation before any renewed push toward higher targets.
Risk Factors & What Could Invalidate The Setups
The following risks can quickly override the current technical picture, especially on a weekly horizon:
- Event risk: Company-specific headlines (product, legal, AI/cloud developments, or corporate updates) can induce gaps that skip key levels.
- Macro risk: Shifts in interest rate expectations, currency dynamics, or broad risk sentiment can magnify or mute the expected 4% weekly move.
- Correlation risk: As a mega-cap, MSFT often moves with peer group sentiment; sector-wide rotations can pressure or lift the stock irrespective of its own signals.
- Technical whipsaws: False breaks around obvious round numbers (520, 530, 540) can trap traders; watch for confirmation via sustained closes rather than intraday stabs.
- Momentum drift: The negative MACD histogram indicates soft momentum; a further deterioration could turn a benign pullback into a deeper mean reversion toward the SMA50 zone (around 495.68).
Invalidation triggers for our scenarios:
- Bullish bias invalidated if MSFT closes decisively below 515.46 and cannot reclaim it on the next attempt, elevating risk of 510 then 500–496 (SMA50).
- Bearish bias invalidated if MSFT reclaims and holds 530 on a closing basis, and the MACD histogram flips higher, supporting a push toward 535–540.
- Base-case range invalidated if price accelerates outside the 500–543 implied band on a closing basis, indicating a volatility regime change.
Putting It All Together
MSFT’s weekly technical posture blends a constructive medium-term trend with near-term momentum softness. Price above SMA20 (515.46) and SMA50 (495.68) keeps the benefit of the doubt with buyers, while the RSI at 59.71 supports this view by staying well below overbought territory. At the same time, a negative MACD histogram urges patience and respect for consolidation dynamics.
For traders and risk managers, the practical playbook revolves around a few concrete lines:
- 520: First nearby pivot. Holds favor the neutral-to-bullish base case; failures bring SMA20 into view.
- 515.46 (SMA20): Primary support in trend. Loss would raise odds of a 510 and possibly 500–496 test.
- 530: First meaningful resistance. Clearance would argue for 535–540 next.
- 540: Higher resistance. A close above would mark a re-acceleration.
Externally, the cited options-based expectation of roughly ±4% by week’s end provides a good volatility yardstick (approximately 500–543). Our base case—512 to 536—acknowledges the supportive trend and soft momentum, reserving the tails for event-driven excursions. Alignment with external technical “Strong Buy” characterizations is partial; we prefer to see MACD momentum improve or a decisive break above 530 to embrace a fully bullish tactical stance.
Editorial Statement
This report is a technical analysis commentary based solely on the snapshot metrics provided (price, SMA20/50, RSI14, MACD 12/26/9) and the three cited external sources. It is not investment advice and does not account for your objectives, financial situation, or risk tolerance. Trading and investing involve risk, including the potential loss of principal. Consider consulting a qualified financial professional before making decisions. Past performance and technical patterns do not guarantee future results. Levels, ranges, and scenarios discussed here are analytical frameworks and may not play out as described, especially if unexpected news or macro shifts occur.
Appendix: Quick Reference Metrics
- Ticker: MSFT
- Close (last): 522.04
- 7-day change: -2.15%
- SMA20: 515.46
- SMA50: 495.68
- RSI(14): 59.71
- MACD (12,26,9): line 9.08; signal 9.72; histogram negative
SEO title: MSFT Weekly Technical Analysis: Uptrend Intact Above Key MAs, But Momentum Softens Into Next Week
SEO description: MSFT weekly technicals: price $522 above 20/50-day SMAs, RSI ~59.7, MACD histogram negative. Scenarios set 500–543 implied range; key levels 515/530/540.