META Weekly Technical Analysis: Price Above Key Averages, Momentum Positive, and Next-Week Scenarios
Executive Summary
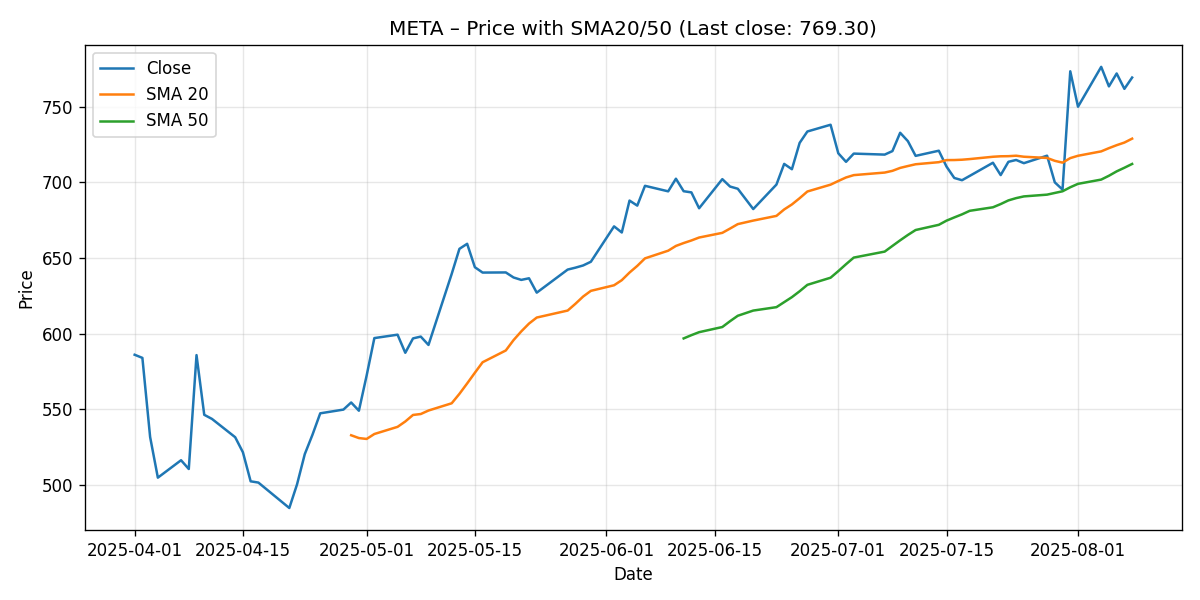
META ended the latest 7-day window at 769.30, slipping by approximately 0.54% week over week. Despite the modest weekly decline, the technical posture remains constructive: price sits decisively above both the 20-day simple moving average (SMA20) at 728.90 and the 50-day simple moving average (SMA50) at 712.17, an alignment consistent with an ongoing uptrend. Momentum indicators also lean bullish. The RSI(14) at 61.63 suggests healthy buying pressure without an overbought condition, while MACD(12/26/9) remains positive at 17.48 with a signal line at 13.19, leaving a positive histogram around 4.29. In short, META retains a bullish technical bias with near-term consolidation risk.
Key takeaways:
- Close: 769.30 (approx.)
- Weekly change: -0.54% (approx.)
- SMA20: 728.90; SMA50: 712.17 — price above both
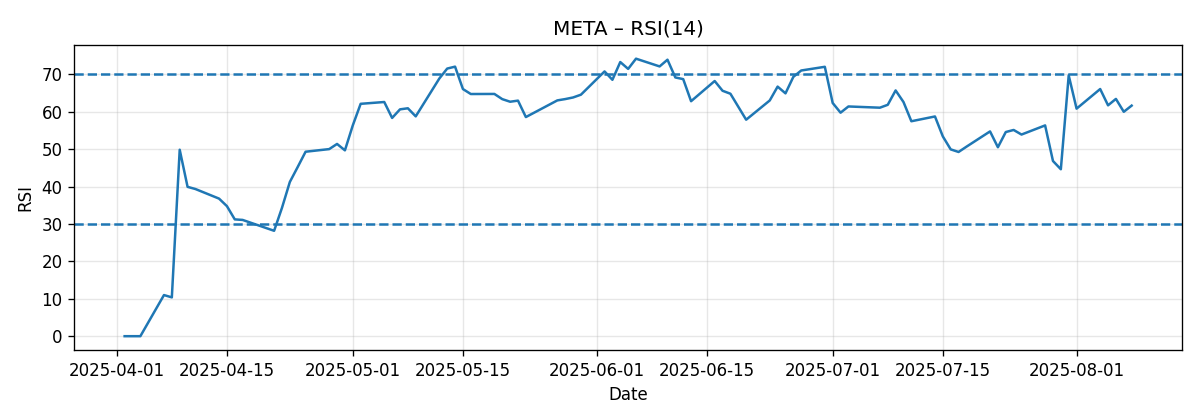
- RSI(14): 61.63 — positive momentum, not overbought
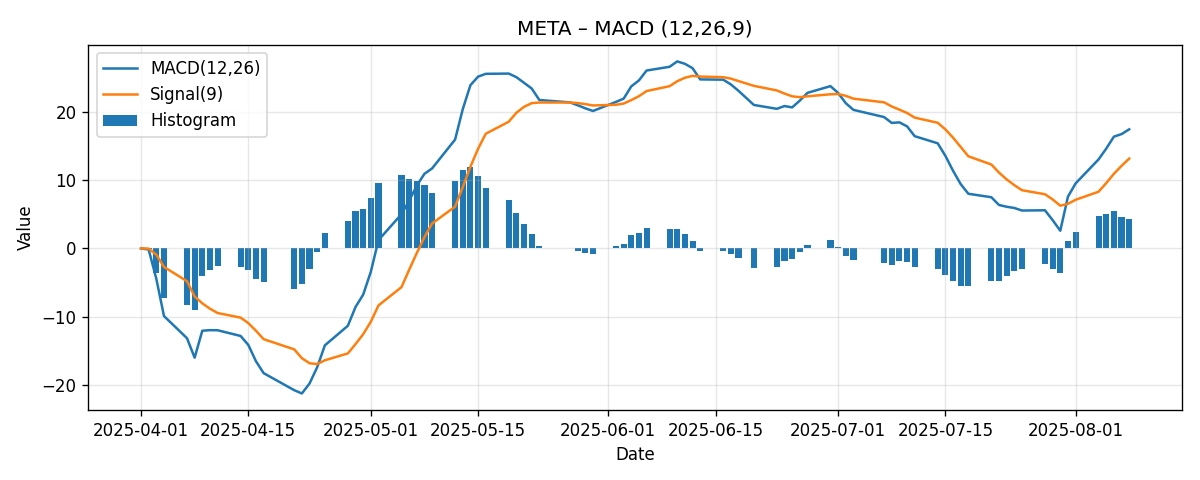
- MACD(12/26/9): 17.48; Signal: 13.19; Histogram: +4.29 — bullish momentum
Our base case expects a constructive, albeit potentially choppy, continuation pattern next week with a working range centered around the mid-to-high 700s. Risk management should focus on the SMA20 and the mid-740s region as first lines of support, while 780–800 represent graduated near-term resistance bands to monitor for breakouts.
Weekly Market Context & Trend
META dipped by roughly 0.54% over the last seven sessions, a modest pullback that looks more like digestion than trend reversal. Crucially, the price remains above the 20-day and 50-day moving averages. When price trades above an upward-stacked set of moving averages (shorter-duration average above a longer-duration average), it often suggests that buyers continue to control the medium-term tape. While we do not have explicit slope data for the moving averages this week, the fact that SMA20 (728.90) sits above SMA50 (712.17) reinforces the bullish structure typically seen in sustained uptrends.
The momentum complex is consistent with that narrative. RSI(14) at 61.63 sits comfortably above the neutral 50 line and below the overbought 70 threshold. That placement frequently coincides with uptrends that still have room to run, as oscillators can remain in 60–70 territory for some time during strong trends without necessarily forcing a reset. Meanwhile, a positive MACD reading that stands above its signal line indicates that the rate of change in price remains in favor of buyers. The MACD histogram around +4.29 corroborates that advantage.
At the same time, a minor weekly decline warns that not all the action is one-way. Short-term traders may be testing upper ranges, taking profits, or pausing to reassess catalysts. Without signs of pronounced deterioration in the indicators, pullbacks toward key supports are more likely to present tactical buy-the-dip opportunities within a broader uptrend than to mark the start of a major downside leg. Still, respect for risk is essential near prominent round numbers and technical pivots, where supply can emerge.
Detailed Technicals (Price + SMA20/50, RSI14, MACD 12/26/9)
Price and Moving Averages
The closing price of 769.30 keeps META above both the 20-day SMA at 728.90 and the 50-day SMA at 712.17. Price is about 40.40 points above the SMA20 (roughly +5.5%) and 57.13 points above the SMA50 (roughly +8.0%). This configuration — price > SMA20 > SMA50 — is classic bullish alignment, often seen in leading issues that have outperformed in recent weeks.
What this means tactically:
- SMA20 (728.90) acts as the first dynamic area of support. Shallow dips that hold or quickly reclaim this neighborhood typically sustain the trend.
- SMA50 (712.17) is a deeper support band, one that can accommodate a more pronounced consolidation without damaging the medium-term trend. A decisive break below the SMA50 would be a notable caution flag.
- Round-number levels remain relevant; with price in the high 700s, intraday swings around 750 and 800 can attract both profit-taking and breakout attempts.
Current interpretation: META’s price is positioned constructively above key trend references. The slight weekly pullback did not inflict technical damage; instead, it appears as routine digestion in the context of an uptrend that remains intact.
RSI(14)
RSI(14) prints 61.63. In classical terms, RSI readings:
- Above 70: overbought
- 50–70: bullish momentum range
- 30–50: bearish momentum range
- Below 30: oversold
At ~61.6, META’s RSI sits squarely in the bullish zone. This suggests buying pressure outweighs selling pressure without yet signaling an overextended condition. From a tactical perspective, RSI in the low 60s often indicates further upside potential if price can resolve above nearby resistance, though shallow pullbacks can occur as the oscillator oscillates within its bullish regime. Watch for:
- RSI pushing toward 65–70: would bolster the case for a momentum breakout attempt.
- RSI slipping under 50: would warn that bulls are losing control of the short-term rhythm, increasing the probability of a test of the SMA20 or lower.
MACD(12/26/9)
META’s MACD stands at 17.48, with a signal line at 13.19. The positive spread of about +4.29 yields a positive histogram, indicating the fast line continues to outpace the slow line. While MACD’s absolute value is security-specific, the positive relationship between MACD and its signal line is the relevant takeaway: momentum remains on the bulls’ side for now.
What to monitor next week:
- Further expansion in the MACD-signal spread would validate continuation attempts and raise the odds of resistance clearance.
- A narrowing spread or bearish crossover (MACD falling below the signal) would be an early warning of stalling momentum and greater risk of a move toward SMA20/50.
Key Levels (Support/Resistance)
The following table summarizes key levels derived from the current snapshot and common technical reference points. Levels are not guarantees; they are zones where trading behavior often changes.
| Level | Type | Rationale | What to Watch |
|---|---|---|---|
| 800 | Resistance | Major round number; potential psychological supply zone | Acceptance above 800 could open room for momentum extension if volume confirms |
| 780 | Near-term Resistance | Intermediate round number just above the current close | Rejections here would signal ongoing consolidation; a clean break would target 800 |
| 769–770 | Pivot / Reference | Area around the latest close; offers a benchmark for intraday bias | Holding above keeps intraday tone constructive; sustained break below shifts focus to 750s |
| 750 | Support | Round-number reference; often an inflection zone in strong trends | Quick rebounds from 750 would signal dip-buying; extended trade below invites a test of SMA20 |
| 747.90 | Support / Prior Pivot | Referenced by external technical note as a rally point; prior pivot often flips to support | Stability above strengthens the bullish case; loss of 747.90 weakens near-term structure |
| 728.90 | Support (SMA20) | First dynamic support in uptrends | Holds suggest routine pullback; a decisive close below would caution that momentum is cooling |
| 712.17 | Support (SMA50) | Deeper trend support | Break below would question the medium-term uptrend and invite a broader consolidation |
Scenario Analysis (Bullish / Bearish / Most-Likely)
These scenarios translate the current technical state into plausible near-term paths. They are not predictions, but structured views to guide planning with clear triggers and invalidation points.
Bullish Scenario
Premise: Buyer control persists, momentum firms, and price clears the 780 area with follow-through. MACD histogram remains positive or expands, RSI climbs toward mid-to-high 60s without diverging. The 750–760 zone is defended on dips.
- Trigger: Sustained intraday acceptance above 780, not just a brief poke.
- Target range for next week: 790–805.
- Invalidation: A daily close back below 750 after failing at 780–800 would downgrade this path to the neutral or bearish case.
Context: With price already 5–8% above SMA20/50, a steady grind higher is feasible if sellers cannot force a meaningful pullback. Breakouts in strong trends often proceed in steps: first clear 780, then tackle 800.
Bearish Scenario
Premise: The modest weekly pullback deepens as momentum cools. Price loses 750 and retests dynamic support. MACD-signal spread narrows, and RSI slips toward 50. This scenario is consistent with a consolidation phase within a larger uptrend, unless SMA50 fails.
- Trigger: Failure at or below 780 followed by a decisive break under 750.
- Target range for next week: 735–750 (with eyes on the SMA20 at 728.90 for potential extension).
- Invalidation: Quick reclaim of 760–770 with improving momentum would neutralize the bearish push.
Context: Even strong trends retrace. A dip toward SMA20 would not, by itself, negate the uptrend; it would represent a normal reset. However, a sustained break below SMA50 (712.17) would carry more serious implications for the medium-term structure.
Most-Likely / Base Case
Premise: META remains constructive but rotational. Price oscillates between the upper-700s resistance band and mid-700s support while momentum indicators stay positive but not extreme.
- Expected range for next week: 750–790.
- Bias: Buy-the-dip near 750–760 has a better-than-average chance of working as long as SMA20 remains intact; upside attempts likely encounter supply into 780–790 on initial tries.
- Watch: Reaction to 780; acceptance above would shift the bias toward the bullish scenario quickly.
Context: The combination of positive MACD, RSI in the low 60s, and price above SMA20/50 usually favors a persistent but uneven advance, punctuated by shallow dips and stair-step gains.
Comparative Outlook: What Others Are Saying vs. Our View
We examined three external perspectives to triangulate our technical stance:
1) Barron’s / Sell-side target lift
Source: Barron’s
“Rob Sanderson increased his price target for Meta to $980 from $888 and reiterated a Buy rating.”
Interpretation: This is a fundamentally driven, long-horizon target. While our analysis is strictly technical and near-term, the bullish structural setup (price above SMA20/50, positive MACD, RSI 61.6) aligns with the spirit of an optimistic outlook. Our difference is time horizon: we focus on next week’s tactical range (e.g., 750–790 base case) rather than a multi-quarter target like 980. In other words, the short-term technicals do not contradict a constructive longer-term thesis, but they highlight nearer resistance at 780–800 that must be negotiated before any larger advance can unfold.
2) MarketPulse / Corrective risk after rally to 747.90
Source: MarketPulse
“Elliott Wave and Fibonacci analysis suggests odds of a medium-term corrective decline after the rally to 747.90.”
Interpretation: This view highlights potential for a corrective phase within an overarching uptrend, a nuance we share in our bearish scenario. However, given the current data, META’s price is now above 747.90 (at 769.30), suggesting that prior pivot may be acting as support rather than an unchallenged ceiling. Our baseline expects consolidation rather than a pronounced correction, primarily because the RSI remains constructive and the MACD histogram is positive. That said, a loss of the 747.90–750 area would bolster the MarketPulse corrective case; we are attentive to that invalidation risk.
3) Investing.com / Technical summary flashing caution
Source: Investing.com
“Technical summary: Strong Sell; Moving Averages: Sell; Technical Indicators: Sell.”
Interpretation: This aggregated snapshot diverges from our reading of the provided indicators. Our inputs show price above the SMA20 and SMA50 and a positive MACD/RSI — a combination that typically does not register as a “Strong Sell” in many frameworks. The discrepancy may arise from differing timeframes, additional indicators (e.g., shorter intraday measures), or a different calculation window. We maintain that, given the data at hand, META’s near-term technical profile is net positive with defined support nearby. We will reassess if the tape loses 750 and especially if it closes below the SMA20 and SMA50 in sequence.
Risk Factors & What Could Invalidate The Setups
Technical setups are probabilistic, not deterministic. Several factors can quickly alter the picture:
- Momentum deterioration: A bearish MACD crossover (MACD falling below the signal) or RSI losing the 50 level would warn that buyers are stepping back, elevating downside risk toward SMA20/50.
- Failure at resistance: Multiple failed attempts to clear 780–800, especially if followed by heavy rejection candles, would suggest supply is in control, increasing the chance of a deeper consolidation.
- Break of dynamic supports: A decisive daily close below the 728.90 (SMA20) level would be the first material caution. A further slide below the 712.17 (SMA50) would mark a more meaningful trend shift.
- Headline risk: For a large-cap platform business, regulatory developments, changes in digital advertising trends, and AI product cadence can create gaps and volatility that overwhelm technical levels in the short run.
- Macro and market tone: Broad market risk-on/risk-off swings frequently amplify or mute individual setups. A risk-off week can drag even strong charts lower; conversely, a bullish tape can facilitate breakouts.
Invalidation checklist for the bullish/base case:
- Close below 750 with a weakening MACD histogram and RSI sliding toward 50.
- Follow-through lower into 728.90 (SMA20) that fails to hold on a retest.
- Subsequent break of 712.17 (SMA50), which would shift the medium-term bias to neutral/bearish pending fresh evidence.
Tactical Playbook for Next Week
While we do not provide trading advice, it is helpful to translate the analysis into a decision matrix that traders and investors can adapt to their own plans and risk tolerances:
- Constructive above 769–770: Intraday holding patterns above the latest close favor probing 780. Acceptance above 780 opens a path toward 790–800, provided momentum confirms.
- Neutral-to-cautious between 750 and 769: Expect back-and-fill. This zone may be a battleground where both sides test conviction. Watch MACD histogram and RSI behavior.
- Cautious below 750: Losing 750 shifts focus to 747.90 and then 728.90 (SMA20). Failure to stabilize in this region suggests that a more meaningful consolidation is underway.
- Trend risk below 712.17: A sustained break below the SMA50 would undermine the medium-term uptrend structure and would require reassessment of the larger bullish thesis.
Why the Indicators Matter Now
In a maturing uptrend, the interplay between price and the SMA20/SMA50 often dictates short-term rhythm. Pullbacks that respect the SMA20 commonly refresh momentum; deeper retracements that tag the SMA50 can reset the trend for a subsequent leg higher — provided the level holds. The RSI serves as a quick pulse check of buying pressure; mid-60s RSI with price above the SMAs favors continuation attempts. MACD’s positive spread supports that case, though it is particularly sensitive to loss of momentum when ranges compress.
Next week, the technical fulcrum is whether META builds acceptance above 780. Do that, and the conversation shifts to testing 800. Fail repeatedly and lose 750, and a garden-variety consolidation likely unfolds toward the SMA20. The indicators we have are aligned enough to keep the base case constructive, but the modest weekly dip is a reminder that each push must still earn confirmation.
Putting It All Together
Summary of the current technical posture:
- Trend: Uptrend intact (price > SMA20 > SMA50).
- Momentum: Positive (RSI 61.6; MACD above signal with a positive histogram).
- Near-term challenge: 780–800 resistance band.
- First support: 750/747.90 zone; then 728.90 (SMA20).
- Deeper trend line: 712.17 (SMA50) — lose it, and the medium-term bias weakens.
- Base-case range for next week: 750–790.
This balanced assessment reflects evidence from price, moving averages, and momentum. The weekly dip of roughly half a percent appears more like consolidation within a strong structure than the beginning of a reversal. Still, the path forward hinges on whether META can convert 780–800 from resistance into support. Until then, expect tactical swings within the band, with dip buyers active above the SMA20 and supply gathering near round-number resistance.
Editorial Statement (Disclaimer)
This report is a technical analysis commentary based solely on the indicators and materials referenced herein. It is intended for informational and educational purposes only and does not constitute investment advice, an offer, or a solicitation to buy or sell any security. Markets involve risk, including the potential loss of principal. Past performance is not indicative of future results. Always conduct your own research and consider your financial objectives, risk tolerance, and time horizon before making any investment decisions. The external sources cited are provided for context; views expressed here are our own and pertain to short-term technicals based on the supplied data snapshot.