NVDA Weekly Technical Analysis: Momentum Firm, RSI Near 70; Watch 180 Pivot with 174.6/159.2 Support
Executive Summary
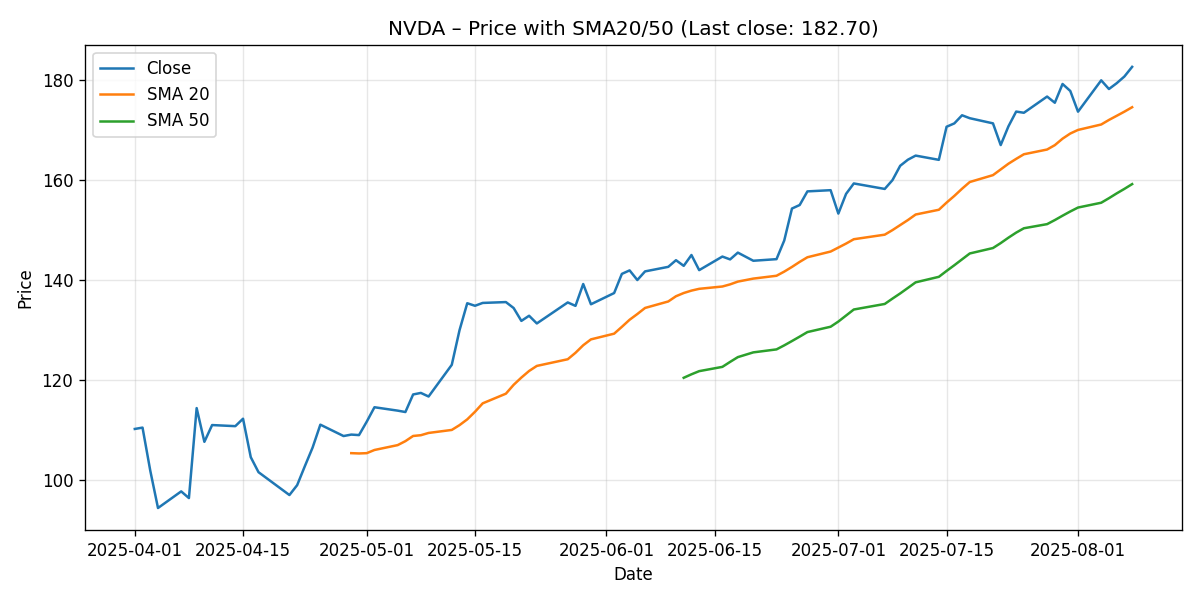
Nvidia (NVDA) closed the week at 182.70, up approximately 2.72% week over week based on the provided seven-day snapshot. Technically, the stock continues to trade in a bullish alignment: price sits above both the 20-day simple moving average (SMA20 at 174.61) and the 50-day simple moving average (SMA50 at 159.21). The trend remains constructive but tactically extended: RSI(14) is at 69.75, flirting with the overbought threshold, while the MACD(12/26/9) line (6.36) is now slightly below its signal line (6.63), leaving a small negative histogram (~-0.27) that signals waning short-term momentum even as the larger trend stays intact.
In practical terms, the stock is about 4.6% above its SMA20 and roughly 14.8% above its SMA50, a spread that confirms upside leadership but also highlights the potential for mean reversion. The 180 round number looks like a tactical pivot; beneath that, 174.6 (SMA20) is first notable support, followed by 159.2 (SMA50). Overhead, 185 and 190 stand out as near-term psychological resistance milestones. Our base case for the upcoming week is consolidation between 178 and 188, with a bullish extension scenario toward 190 if momentum re-accelerates, and a bearish mean-reversion scenario toward the SMA20 (~174.6) if the MACD softening continues.
- Last close: 182.70
- Weekly change: +2.72%
- SMA20: 174.61 (price ~4.6% above; ~4.4% downside to retest)
- SMA50: 159.21 (price ~14.8% above; ~12.9% downside to retest)
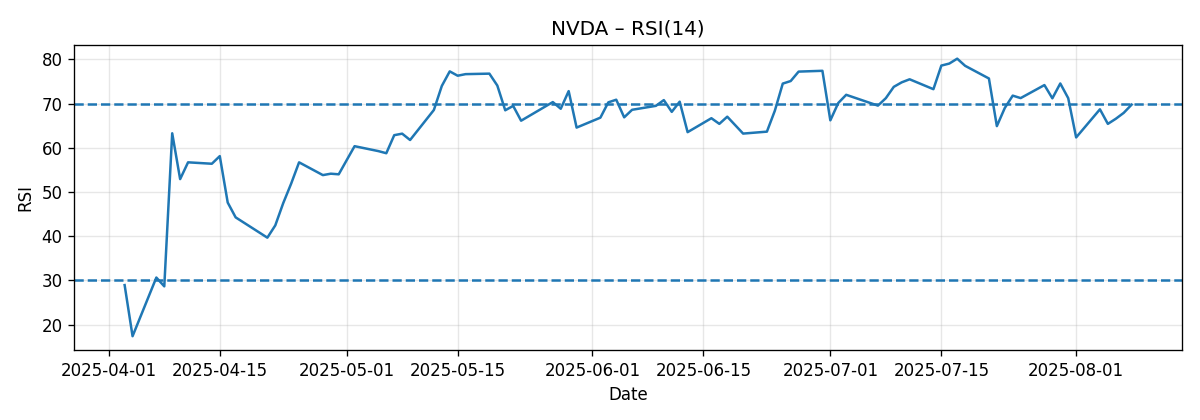
- RSI(14): 69.75 (near overbought)
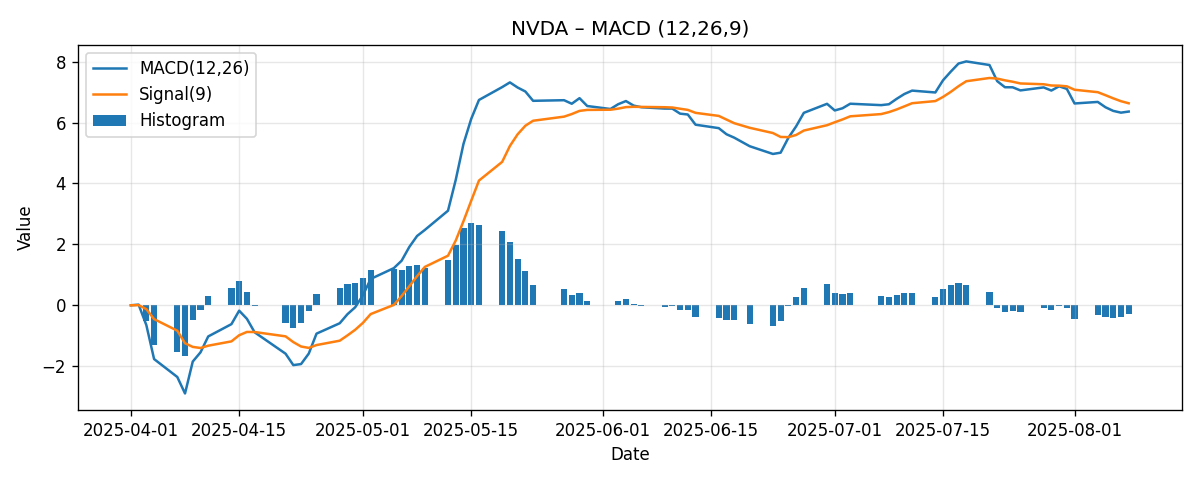
- MACD(12/26/9): 6.36 vs signal 6.63 (histogram ~-0.27)
External research remains broadly bullish on the medium-to-long-term AI theme. Reuters noted Loop Capital’s $250 price target alongside a “Golden Wave” thesis, while Investor’s Business Daily (IBD) flagged NVDA as overextended above a technical buy point at 160.79, and cited BofA’s $220 price target as supportive of the structural story. Our technical read is consistent with that tilt: the secular uptrend is intact, but near-term conditions are stretched and momentum is softening—making a short period of digestion or a pullback to the 20-day average reasonable before any next leg higher.
Weekly Market Context & Trend
With a +2.72% week-over-week gain, NVDA maintained upward pressure even as traditional oscillators moved into elevated territory. The stock’s posture above the 20-day and 50-day moving averages conveys a defined uptrend on both tactical (SMA20) and intermediate (SMA50) time frames. The gap from price to the 50-day average—about 14.8%—underscores a pronounced leadership profile typical of strong momentum names. However, the larger this spread gets, the more frequent and sharper the pullback attempts tend to be as mean reversion forces reassert.
RSI at 69.75 reflects an almost overbought condition. That in itself is not a sell signal; strong trends can stay overbought for extended periods. But when RSI approaches or exceeds 70 while MACD’s histogram turns slightly negative, it often foreshadows a near-term moderation in upside velocity. This relationship is at the heart of the current context: NVDA’s trend has been resilient, yet the marginal momentum impulse is easing.
Given the above, this week’s trend read can be summarized as follows:
- Directional bias: Uptrend intact (price > SMA20 > SMA50).
- Momentum state: Strong but tiring (RSI ~70; MACD histogram slightly negative).
- Tactical pivot: 180 (psychological level and just below the last close).
- First magnet on weakness: SMA20 around 174.6.
Detailed Technicals (Price, SMA20/50, RSI14, MACD 12/26/9)
Price vs SMA20 and SMA50
NVDA’s last close at 182.70 places it roughly 4.63% above the 20-day moving average (174.61) and approximately 14.75% above the 50-day moving average (159.21). In risk terms, that means it would take about a 4.43% pullback from current levels to tag the 20-day average and around a 12.86% decline to reach the 50-day average.
Such a configuration—price above the 20-day, which itself is above the 50-day—is a classic uptrend confirmation. Without additional historical slope data, we refrain from asserting the rate of change for those averages, but the current ordering nonetheless supports a bullish intermediate posture.
In this zone, moving averages often act as dynamic support/resistance:
- SMA20 (174.61): The first likely demand area on a routine pullback in a healthy trend. A test and bounce here would be consistent with continuation.
- SMA50 (159.21): The deeper support associated with trend integrity. A decisive break below often signals a trend transition from strong uptrend to neutral or corrective.
Nearest psychological levels around price include 180 (recent pivot area), 185 (first near-term resistance checkpoint), and 190 (a larger psychological milestone). In the absence of intraday highs/lows or multi-week swing points in the data provided, these round numbers, along with the moving averages, serve as our primary reference levels.
RSI(14)
RSI(14) closed at 69.75, brushing against the conventional overbought line at 70. Two important points about this reading:
- Strong trends can maintain elevated RSI for longer than expected. Overbought does not automatically mean “due to crash.”
- When overbought conditions coincide with a softening MACD histogram, odds of consolidation or a mild pullback increase in the very short term.
Practically, RSI near 70 signals that the bull case has already exerted itself over the recent window. Additional upside may require a brief reset—often via sideways action that cools RSI while price digests prior gains. A constructive consolidation would look like several sessions oscillating between roughly 178 and 188, during which RSI slips back toward the mid-60s without price giving up the SMA20.
Risk to watch: a rapid push well above 70 on RSI can happen under powerful momentum flows, but if it occurs while MACD remains soft, it may be vulnerable to a subsequent fast fade. Conversely, a small pullback that brings RSI back into the 55–65 range, coupled with price holding or reclaiming the 20-day average, would reset the risk/reward for a potential next leg higher.
MACD(12/26/9)
MACD line is 6.36, just below the signal line at 6.63, leaving an approximately -0.27 histogram. In plain terms, shorter-term momentum is decelerating within a still-strong trend. This does not automatically imply broader weakness; instead, it often precedes a digestion phase.
What to monitor:
- Re-cross higher: If MACD turns back above its signal, the histogram will flip positive—an early cue that upside momentum is reasserting. In that case, resistance zones like 185 and potentially 190 come into view more quickly.
- Further softening: If MACD decays further below its signal line, the market may opt to mean-revert toward the SMA20 (174.6). A decisive loss of the 20-day would then place 170 (psychological) and 159.2 (SMA50) into focus.
The bull case would be strengthened by a shallow consolidation that allows the MACD to stabilize near the zero line (or to curl upward) while price stays above the rising 20-day average. The bear case gains traction if soft momentum meets a break of 174.6 on convincing breadth and volume (volume not provided here, so we focus on price and indicator behavior).
Key Levels (Support/Resistance)
Given the information provided, the following levels are most actionable. The supports derive primarily from the 20- and 50-day moving averages and nearby psychological thresholds; the resistances are psychological levels above spot that commonly attract supply during extended moves.
| Level | Type | Price | Rationale |
|---|---|---|---|
| 190 | Resistance | 190.00 | Round-number psychology above current price; potential profit-taking zone in an extended trend. |
| 185 | Resistance | 185.00 | Near-term psychological checkpoint just above the last close; often acts as a near resistance in stair-step advances. |
| 180 | Pivot | 180.00 | Round-number pivot near spot; losing 180 would open room to test the 20-day average. |
| SMA20 | Support | 174.61 | First dynamic support in a strong trend; a routine mean-reversion target. |
| 170 | Support | 170.00 | Intermediate round-number psychology below the 20-day average. |
| SMA50 | Support | 159.21 | Trend-defining support; a decisive break would threaten the intermediate uptrend. |
Scenario Analysis (Next Week)
Bullish Scenario
Setup: RSI cools modestly or stabilizes near 65–70 without breaking down; MACD histogram flattens or flips positive; price holds above 180 and pushes through 185.
Projection (next week): 186 to 192, with 190 as the primary objective and 192 as an extension level if momentum returns quickly.
Triggers:
- Daily closes above 185 with follow-through buying the next session.
- MACD line re-crossing above its signal line.
- RSI maintaining elevated levels without negative divergence.
Risk Management Considerations: If price fails to hold 185 after a breakout attempt and slips back below 180, the bull case likely transitions into the base case or a deeper pullback.
Most-Likely (Base) Scenario
Setup: The stock digests gains with a controlled consolidation, oscillating around the 180–185 band. MACD remains near flat/slightly negative, and RSI drifts from ~70 toward the mid-60s, reflecting a healthy cooldown.
Projection (next week): 178 to 188, with intraday tests on both sides but closes clustering in the low- to mid-180s.
Triggers:
- Repeated intraday fades near 185 without decisive rejection.
- Shallow dips that respect or quickly reclaim 180.
- MACD histogram hovering near zero but not notably deteriorating.
Risk Management Considerations: A decisive break below 180 that accelerates into 176–175 would suggest the bearish scenario is unfolding more rapidly than expected.
Bearish Scenario
Setup: Momentum softens further; MACD continues below its signal line and expands the negative histogram; price loses the 180 pivot and heads toward the SMA20.
Projection (next week): 172 to 180, with a high-probability test of 174.6 (SMA20). A daily close below the SMA20 would put 170 and, with further pressure, 165–162 in play, though our primary supports of record are 174.6 and 159.2.
Triggers:
- Two consecutive closes below 180.
- A daily close below ~174.6 (SMA20), especially if followed by a failed retest from beneath.
- RSI slipping back toward 55–60 with MACD deteriorating.
Risk Management Considerations: Should price quickly reclaim 180 after a false breakdown, the bear setup is invalidated and likely reverts to base-case consolidation.
Comparative Outlook: How Our View Stacks Against External Calls
We consider three external perspectives, all provided by the user, to contextualize our technical stance:
1) Reuters: Loop Capital’s $250 Target and the “Golden Wave” Thesis
Reuters wrote: “Loop Capital lifted its price target for Nvidia to $250, maintaining its ‘buy’ rating.” (link)
Our take: This is fundamentally bullish and aligns with the secular AI infrastructure narrative. From a technical perspective, our indicators support a constructive intermediate trend but suggest the stock is tactically stretched (RSI ~70, price ~4.6% above SMA20 and ~14.8% above SMA50). We therefore reconcile the Reuters/Loop Capital long-term optimism with a short-term expectation of consolidation or a mild pullback, which, if it occurs and holds above trend supports, would refresh the uptrend and be consistent with eventually pursuing higher fundamental targets.
2) Investor’s Business Daily (IBD): Overextended Above a 160.79 Buy Point
IBD states: “The stock is overextended above its technical buy zone at 160.79.” (link)
Our take: This dovetails directly with our technical read. At 182.70, NVDA trades roughly 13.6% above that 160.79 buy point—a degree of extension that often invites digestion. Our base case calls for consolidation around 180–185, with a realistic pullback path to the 20-day average (~174.6) if momentum cools further. We are therefore aligned with IBD’s caution about extension while still recognizing the broader uptrend.
3) Investor’s Business Daily (IBD): BofA’s Vivek Arya Maintains a $220 Price Target
IBD notes: “BofA’s Vivek Arya maintained a ‘buy’ rating on Nvidia with a $220 price target.” (link)
Our take: This target falls between the 185–190 resistance band we outline for the near term and the loftier 250 cited by Loop Capital. Technically, a steady stair-step path—interspersed with consolidations at the 20-day average—would be a plausible way for price to progress toward intermediate targets such as 200–220 over time. Our near-term caution does not conflict with BofA’s constructive view; rather, it recognizes that strong trends often advance via alternating expansion and digestion phases. The current indicator mix leans toward a digestion phase next.
Risk Factors & What Could Invalidate the Setups
While our analysis relies on the provided technical indicators, several general market and company-specific risks can alter the setup quickly. We avoid fabricating non-provided data; the list below frames how exogenous developments could interact with the technical picture:
- Momentum re-acceleration risk (to the upside): If buyers force a swift MACD recross above the signal and RSI pushes decisively over 70, NVDA could break through 185 and challenge 190 sooner than our base case suggests. That would invalidate a near-term consolidation thesis.
- Break of trend supports (to the downside): A decisive close below the 20-day average (~174.6), especially if followed by a failed retest from beneath, would shift the bias to a deeper pullback toward 170 and potentially the 50-day (~159.2). That would challenge the integrity of the short- to intermediate-term uptrend.
- Sector/theme headline sensitivity: As external articles note, the AI/data center theme is central to NVDA’s narrative. Positive or negative headlines related to enterprise AI deployments, data center spending trends, or competitive dynamics could create outsized moves that overwhelm near-term technical setups.
- Round-number gravity: Levels like 180, 185, and 190 can amplify whipsaws. A false breakout above 185 that rapidly reverses below 180 can trap momentum chasers and accelerate a tag of 174.6.
- Indicator divergence risk: If price inches higher but MACD and RSI exhibit non-confirmation (e.g., lower MACD peaks, RSI failing to clear prior highs), risk of a sharper corrective move rises.
- Liquidity vacuums: In strong uptrends, downdrafts can be swift when bids step away. The 4–5% gap to the SMA20 can be traversed quickly in a single adverse session, even without a change in the broader thesis.
Invalidation map:
- Bullish breakout case invalidated if price fails above 185 and closes below 180 with a deteriorating MACD.
- Base-case consolidation invalidated if price breaks and closes below 174.6; that shifts us to the bearish path toward 170/159.2.
- Bearish scenario invalidated if a breakdown attempt below 180/174.6 is quickly reclaimed, accompanied by a MACD recross higher and closes back above 185.
Putting It All Together
NVDA ends the week technically strong but tactically stretched. The price’s leadership over the SMA20 and SMA50 validates the prevailing uptrend, while the near-70 RSI and slightly negative MACD histogram argue for a period of catch‑up by the averages, ideally through sideways digestion rather than a deep retracement. The market’s decision point resides around the 180–185 corridor: sustained closes above that band would embolden a push to 190, whereas failure to hold 180 would pivot focus to 174.6 (SMA20). The larger intermediate support remains at 159.2 (SMA50).
This configuration marries well with the external research narrative: secularly constructive (Loop Capital $250, BofA $220) but with near-term overextension recognized by IBD’s commentary about the 160.79 buy point. Our tactical stance is thus moderately cautious within a bullish frame—preferring to buy strength after a reset or on pullbacks to high-quality support rather than chasing into elevated RSI with softening MACD.
Actionable Checklist for the Coming Week
- Monitor 180: Holding above keeps the consolidation/base case intact; losing it raises odds of a 174.6 test.
- Watch 185/190: These are the first resistance hurdles on a renewed momentum push. A clean break-and-hold above 185 telegraphs 190 next.
- Track RSI and MACD: A MACD recross up with RSI stabilizing in the mid-60s would support the bullish scenario; further MACD deterioration with RSI slipping into the high-50s supports the bearish scenario.
- Risk to SMA20: Expect responsive buyers near 174.6 in a healthy trend; a firm break below implies a change in character.
- Intermediate guardrail: SMA50 (159.2) is the line of defense for the intermediate trend. It is a long way down from current levels, but it’s the must-hold to keep the bigger-picture uptrend unchallenged.
Editorial Statement (Disclaimer)
This report is a technical analysis based solely on the price, moving averages (SMA20, SMA50), RSI(14), and MACD(12/26/9) figures provided, supplemented only by the three external links cited above. It does not incorporate non-provided fundamental data, earnings results, or macro indicators. The discussion of scenarios, levels, and ranges reflects a good-faith analytical opinion and is not a prediction or a guarantee. Markets are inherently uncertain, and short-term price paths can vary widely from expectations due to unforeseen events or liquidity conditions. This content is for informational purposes only and should not be considered investment advice or a recommendation to buy or sell any security. Always perform your own due diligence and consider your risk tolerance, time horizon, and diversification before making trading or investment decisions.
Appendix: Indicator Snapshot
- Ticker: NVDA
- Last close: 182.70
- 7-day change: +2.72%
- SMA20: 174.61
- SMA50: 159.21
- RSI(14): 69.75
- MACD(12/26/9): 6.36
- MACD Signal: 6.63
- MACD Histogram: ~-0.27
Methodological Notes
Because only a seven-day snapshot was provided, the analysis focuses on the relationship between the last close and the specified indicators rather than on a detailed reconstruction of recent swing highs/lows, intraday breadth, or volume. Support/resistance levels rely on:
- Dynamic supports from the SMA20 and SMA50.
- Psychological round numbers near the last close (e.g., 180, 185, 190).
This approach avoids fabricating non-provided reference points while still delivering a pragmatic trading framework.