AMZN Weekly Technical Analysis: Pullback Between 20- and 50-Day Averages; Watch 233 Resistance and 219 Support
Executive Summary
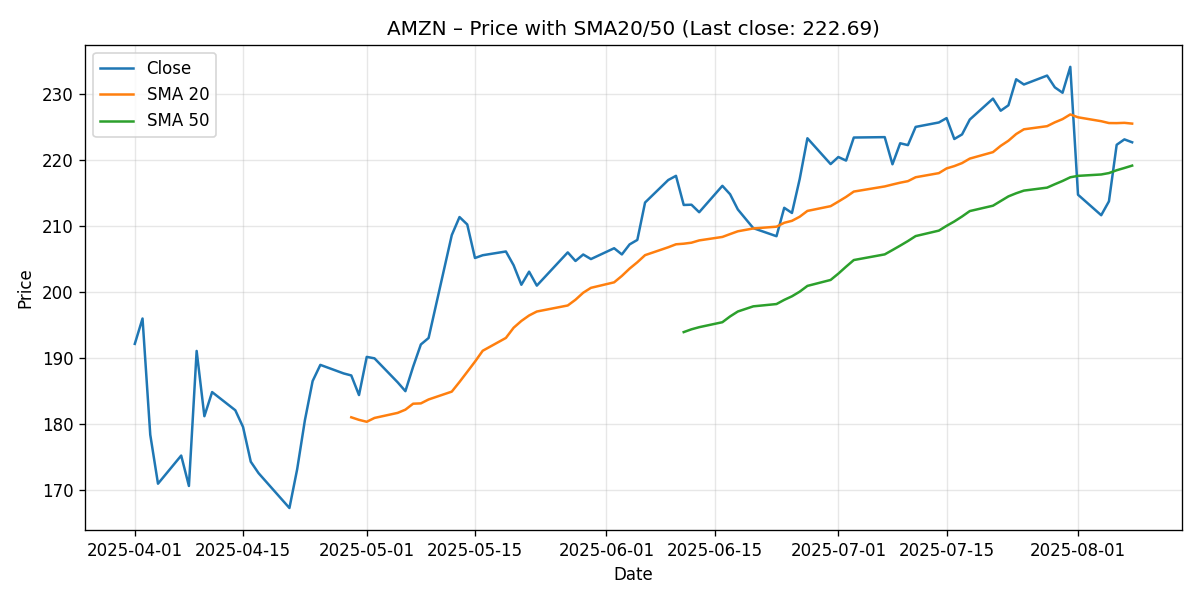
As of the August 9, 2025 snapshot, Amazon.com, Inc. (AMZN) closed at 222.69, finishing the week down 4.88%. Price sits below the 20-day simple moving average (SMA20) at 225.52 but remains above the 50-day simple moving average (SMA50) at 219.16, placing the stock in a short-term pullback within a still-constructive intermediate trend. Momentum is neutral-to-soft: the 14-day Relative Strength Index (RSI14) sits at 50.34 (near the midpoint), while the MACD line (12/26/9) at 0.36 is below its signal line (1.74), yielding a negative histogram and flagging a near-term bearish momentum crossover.
- Last close: 222.69
- Week-over-week change: -4.88%
- SMA20: 225.52 (price is 1.27% below)
- SMA50: 219.16 (price is 1.59% above)
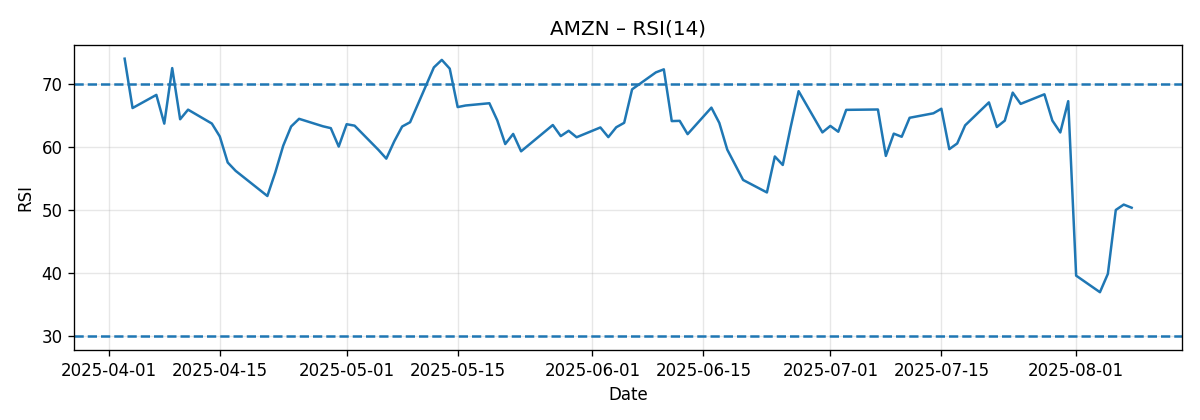
- RSI14: 50.34 (neutral)
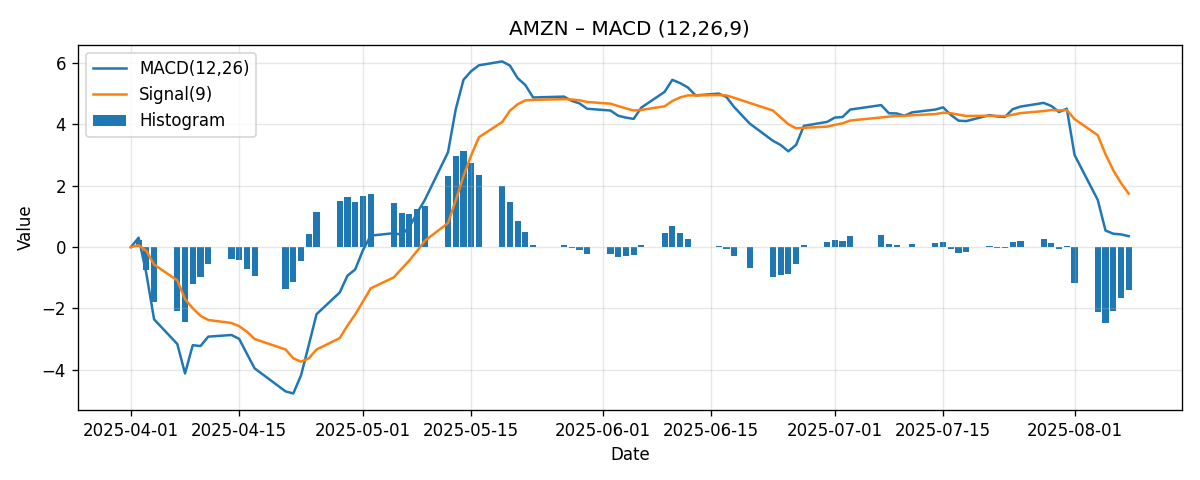
- MACD (12/26/9): 0.36, Signal: 1.74 (MACD below signal; histogram negative)
External technical and fundamental context provides key reference points. According to Investopedia, “Key support levels are $199, $190, $175; major resistance sits near $233.” (link). Investor’s Business Daily notes, “Amazon remains within a buy range after surpassing a 214.84 entry point in a cup with handle.” (link). On the longer-term sentiment front, Pivotal Research raised its price target to $285, maintaining a buy rating (link), underscoring supportive longer-term expectations, even if near-term technicals are mixed.
Our base case for the coming week is range-bound consolidation between 219 and 229 as AMZN digests last week’s pullback, with directional confirmation hinging on whether price reclaims the SMA20 (~225.5) or loses the SMA50 (~219.2). We outline bullish and bearish alternatives below with specific numerical ranges and invalidation levels.
Weekly Market Context & Trend
AMZN declined 4.88% week-over-week to 222.69. That move pulled the stock beneath the SMA20 (225.52), but it remains above the SMA50 (219.16). With the 20-day average itself above the 50-day (225.52 > 219.16), the medium-term structure is still constructive. However, the immediate, short-term momentum has softened—typical of a pullback within a broader uptrend—especially when weekly price action finishes below the shorter moving average.
The weekly decline relocates AMZN into a tactically sensitive band where incremental developments often determine next leg direction:
- Immediate overhead test: reclaiming the SMA20 (~225.5). A decisive daily close back above the 20-day would signal buyers are reasserting control after the pullback.
- Immediate downside test: holding the SMA50 (~219.2). A sustained break below the 50-day would shift the tone more defensively and put nearby chart references into play (notably the 214.84 pivot flagged by IBD).
Momentum indicators bear out this push-and-pull dynamic. RSI14 at 50.34 reflects a balance of forces—neither overbought nor oversold—and MACD’s line sitting below its signal line denotes a near-term momentum lapse following the weekly drop. This combination often suggests consolidation unless and until a clear level breaks.
Importantly, external levels cited by Investopedia—support at 199/190/175 and resistance near 233—frame the broader technical map. With AMZN now roughly 4.6% below 233 and 10.6% above 199, the stock sits mid-range between a well-defined ceiling and deeper supports, creating a symmetry conducive to two-sided trade while the market digests recent information.
Detailed Technicals
Price and Moving Averages
Price at 222.69 is perched between the 20-day and 50-day moving averages:
- Versus SMA20 (225.52): AMZN is 1.27% below, indicating near-term supply pressure. This moving average is now the first overhead resistance to monitor.
- Versus SMA50 (219.16): AMZN is 1.59% above, indicating intermediate-term support remains intact thus far.
The configuration where SMA20 is above SMA50 (225.52 > 219.16) is typically associated with an intact intermediate uptrend. However, price residing below the SMA20 warns that the short-term swing has turned corrective. The junction of these observations often produces consolidation with a directional bias determined by how price behaves around the two averages.
Key tactical implications of the current placement:
- If AMZN can reclaim and hold above ~225.5, short-term buyers may attempt a push toward the 233 area noted by Investopedia. This would also nudge RSI higher and could begin to narrow the MACD-signal gap.
- If the stock fails to reclaim ~225.5 and instead slips beneath ~219.2, the risk shifts toward retesting the IBD-cited 214.84 pivot. A decisive failure there would open the door to the deeper support ladder at 199/190/175 discussed by Investopedia.
RSI14: Neutral Posture at 50.3
The RSI14 reads 50.34—just above the 50 midline. This is consistent with the technical picture of a pullback inside a broader uptrend: the indicator is neither stretched nor signaling exhaustion. In practical terms:
- Above 50 generally supports a mild bullish bias; however, the proximity to 50 implies that a small move can tilt momentum either way.
- A sustained move up through the mid-50s would be evidence that buying pressure is reasserting, increasing the odds of a retest of overhead levels (SMA20 and then ~233).
- A drift down toward the mid-40s would emphasize the risk of losing the SMA50 and probing the 214.84 area.
Given this neutral posture, RSI is best used next week as a confirmation tool. For example, if price reclaims the SMA20 and RSI lifts toward 55–60, the bounce would carry greater credibility. Conversely, if price loses the SMA50 and RSI slips below 45, the probability of a more extended pullback increases.
MACD (12/26/9): Bearish Crossover, Negative Histogram
The MACD line at 0.36 sits below its signal line at 1.74, producing a negative histogram of approximately -1.39. This indicates that while the MACD level remains nominally positive, momentum has swung bearish relative to recent trend.
- MACD below signal: near-term downside or sideways pressures tend to persist until a cross back above the signal occurs.
- Histogram magnitude: the gap between MACD and its signal, while negative, is not extreme; it leaves room for either stabilization or further deterioration depending on how price reacts to the nearby moving averages.
An upturn in MACD that closes the gap with the signal line would often coincide with price reclaiming the SMA20. Alternatively, continued divergence (MACD moving further below the signal) would typically align with a failure of the SMA50 and a test of deeper supports.
Key Levels (Support/Resistance)
The table below consolidates the key static and dynamic levels currently in focus, their origin, and the percentage distance from the last close (222.69). Positive percentages are above current price (resistance/overhead); negative percentages are below (support/underfoot).
| Level (USD) | Type | Source | Rationale | Delta vs Last Close |
|---|---|---|---|---|
| 233.00 | Resistance (static) | Investopedia | “Major resistance sits near $233.” | +4.63% |
| 225.52 | Resistance (dynamic) | Snapshot (SMA20) | Nearest moving-average cap after the weekly pullback. | +1.27% |
| 219.16 | Support (dynamic) | Snapshot (SMA50) | First intermediate trend support. | -1.59% |
| 214.84 | Support (pivot) | Investor’s Business Daily | “Buy range after surpassing a 214.84 entry point.” Serves as support while above it. | -3.52% |
| 199.00 | Support (static) | Investopedia | Key support level. | -10.64% |
| 190.00 | Support (static) | Investopedia | Secondary key support. | -14.69% |
| 175.00 | Support (static) | Investopedia | Deeper support area. | -21.41% |
Takeaways:
- Near-term battleground is tight: only +1.27% to reclaim the SMA20 and -1.59% to test the SMA50. Expect responsive trade around these bands.
- 233 remains a prominent overhead level. If recaptured, it could act as a springboard; if it rejects price, consolidation likely persists.
- Below 219, 214.84 becomes the next obvious technical waypoint before the larger, more strategic 199/190/175 support staircase.
Scenario Analysis (Next Week)
We outline three actionable scenarios for the coming week based on the current technical configuration. These are not predictions but structured paths that can help frame decision-making and risk control.
1) Bullish Scenario
Setup: Price stabilizes above the 50-day (219.16), quickly reclaims the 20-day (225.52), and attracts momentum buying toward the 233 area.
- Triggers: A daily close above ~225.5 with RSI firming above ~52–55; MACD histogram contracting toward zero.
- Projected range (next week): 225.5 to 233.0, with a stretch potential toward 234–235 if 233 breaks on a closing basis.
- Invalidation: A close back below ~222 after reclaiming the 20-day would weaken the thrust. A daily close under ~219.2 decisively invalidates the bullish path for the week.
Rationale: The close proximity to the 20-day means the overhead reclaim only requires about a 1.3% move—well within normal daily variance. Once back above, the first notable static level is 233 (about 4.6% above current price), which has been cited as major resistance. A constructive RSI and a narrowing MACD-signal gap would confirm improving breadth and momentum.
2) Bearish Scenario
Setup: Sellers press price below the 50-day (219.16), leading to a test of the 214.84 pivot (IBD). Failure there raises the risk of a more meaningful retracement toward the Investopedia supports.
- Triggers: Break and daily close below ~219.2 with RSI slipping below ~45; MACD histogram widening negatively.
- Projected range (next week): 212.0 to 219.0, with tail risk extension toward 209–205 if 214.84 fails convincingly. Deeper outliers include 199 if selling accelerates, though that is a larger move than base expectations for a single week absent a shock.
- Invalidation: Rapid recovery back above ~222 and especially a daily close above ~225.5 would neutralize the week’s bearish setup.
Rationale: A loss of the 50-day often begets further testing, particularly of recent breakouts or pivots—in this case, the 214.84 level. If that fails, the chart loses the benefit of the doubt and the path of least resistance shifts down toward broader supports. The MACD already being below its signal line strengthens the case that downside or sideways drift can persist absent a positive catalyst.
3) Most-Likely Scenario (Base Case)
Setup: Two-way trade between the 50-day and the 20-day, with tests of both, and no sustained breakout or breakdown. The market digests last week’s decline while waiting for a fresh catalyst.
- Projected range (next week): 218.5 to 229.5, with intraday excursions possible but closes likely clustering inside that band.
- Upside resolution cue: A daily close above ~225.5 that holds on a retest, accompanied by RSI lifting toward mid-50s.
- Downside resolution cue: A daily close below ~219.2 and failure to remount it the following session.
Rationale: With price within 1–2% of both key moving averages, mixed momentum (RSI ~50, MACD below signal), and a prominent resistance at 233 still overhead, the path of least resistance for the next few sessions is consolidation. This allows indicators to reset and levels to clarify.
Comparative Outlook: How Our View Stacks Up
We compare our technical stance with three external reference points, highlighting alignment and differences.
Investopedia: Watch 233 Resistance and 199/190/175 Supports
Quoted view: “Key support levels are $199, $190, $175; major resistance sits near $233.” (source)
Alignment: We concur that 233 is the marquee overhead level in the near term; it is approximately 4.6% above the last close and is the logical target after a successful reclaim of the SMA20. On the downside, we also recognize 199/190/175 as structurally important stair-step supports.
Difference: Our weekly playbook places more immediate emphasis on the moving averages (SMA20 at 225.52 and SMA50 at 219.16) and the IBD-referenced pivot at 214.84, because price is currently sandwiched between the 20- and 50-day averages. Practically, AMZN is unlikely to engage 199 unless it first loses the 50-day and then 214.84. So while we respect the deeper supports, we consider them second-order for the coming week unless a significant negative catalyst emerges.
Investor’s Business Daily: Still Within a Buy Range Above 214.84
Quoted view: “Amazon remains within a buy range after surpassing a 214.84 entry point in a cup with handle.” (source)
Alignment: Our analysis treats 214.84 as a critical tactical support. With the current price at 222.69, AMZN remains above that threshold, consistent with the notion that the breakout (or entry) level is intact and can act as support on pullbacks.
Difference: In the very near term, we are somewhat more neutral due to the MACD’s bearish crossover and price’s position below the 20-day. We do not dispute the broader constructive backdrop implied by IBD; rather, we highlight that near-term momentum has cooled and that confirmation (via an SMA20 reclaim) would improve the odds of upside follow-through.
Pivotal Research: Raised Price Target to $285 (Buy)
Quoted view: “Pivotal Research raised its Amazon price target to $285 from $260, maintaining a buy rating.” (source)
Alignment: The raised target signals constructive longer-term expectations, which is broadly consistent with a 20-day above the 50-day and a price still above the 50-day—hallmarks of an intermediate uptrend.
Difference: Our weekly focus is strictly technical and short horizon. A 285 target speaks to a fundamentally grounded, multi-month view. Over the next week, we prioritize whether AMZN can reclaim 225.5 and then attack 233, rather than extrapolating to distant price targets. We treat the analyst upgrades as tailwinds but do not anchor weekly trading plans to them.
Risk Factors & What Could Invalidate the Setups
Even well-structured scenarios can be derailed by new information or regime shifts. The following risks could materially change the technical outlook:
- Macro market risk: Broad index volatility, changes in monetary policy tone, or unexpected macroeconomic data can overwhelm stock-specific levels. A broad risk-off move can push AMZN through supports faster than technicals alone would suggest.
- Company-specific headlines: While our analysis is based solely on the provided technical snapshot, unexpected company developments can abruptly change momentum and render nearby levels less reliable.
- Technical momentum regime change: If RSI quickly slips under ~45 and MACD’s histogram expands further negative, the stock can migrate from consolidation into a trend-down state irrespective of the moving averages, raising the odds of breaking 214.84.
- False breaks: It is not unusual for price to briefly pierce the SMA20 or SMA50 and then reverse. This increases whipsaw risk around 225.5 and 219.2. Confirmation via closes and follow-through is essential.
Invalidation cues for each scenario:
- Bullish scenario invalidation: Failure to hold above the reclaimed SMA20 on a retest, or a daily close under the SMA50 (219.16).
- Bearish scenario invalidation: Swift recovery back above ~222 followed by a close above ~225.5.
- Base case invalidation: A decisive breakout above ~229–230 en route to 233, or a decisive breakdown below ~218 with acceleration to 214.84.
Putting It All Together: A Structured Plan for the Week
Given the current setup—price between the 20- and 50-day, neutral RSI, and MACD below its signal—the most pragmatic framework is to let the market reveal direction at the boundaries and respond accordingly. Here is a concise playbook for interpreting the coming sessions:
- Above 225.5 (SMA20 reclaim): Bias turns tactical-bullish toward 228–233. A daily close over 233 would represent a meaningful improvement and could evolve the most-likely scenario into a trending week higher.
- Between 219.2 and 225.5: Expect two-way trade with a modest upward drift only if RSI firms and MACD flattens. This is the zone most consistent with a range-bound week (our base case 218.5–229.5).
- Below 219.2 (SMA50 loss): Bias turns defensive toward 216–215 and then 214.84. A sustained break of 214.84 would open the path toward the larger support staircase at 199/190/175 per Investopedia.
Risk-reward geometry near current price is balanced: roughly +1.3% to first overhead average vs -1.6% to first downside average, and +4.6% to the prominent 233 resistance vs -3.5% to the 214.84 pivot. This symmetry supports the base case of consolidation unless an external catalyst or a decisive level break tips the scale.
Additional Observations and Nuances
Several additional points can help refine expectations without requiring extra data beyond the snapshot:
- 20/50-day relationship: With SMA20 above SMA50, the intermediate trend remains constructive. Pullbacks into the 50-day often attract dip buyers in such regimes—until proven otherwise. However, repeated failures to reclaim the 20-day can erode this advantage over time.
- Momentum transition risk: MACD below its signal, together with an RSI hovering at 50, can precede a bigger move in either direction. Watch for momentum confirmation alongside price action at the moving averages to avoid false starts.
- Level clustering: The confluence of SMA50 (~219.2) and the IBD pivot not far below (214.84) creates a two-step defense. Even if 219.2 breaks, bulls have a second chance to defend 214.84 before the setup shifts decisively bearish.
- Overhead headroom: If AMZN reclaims the 20-day, it faces roughly 3.3% of room to 233 after that reclaim (from 225.5 to 233), which is ample for a weekly test, making upside attempts feasible if buyers step in.
Conclusion
AMZN enters the week in a tactically important equilibrium: short-term caution (below SMA20, MACD below signal) buffered by intermediate-term support (above SMA50, SMA20 > SMA50). RSI near 50 underscores neutrality and the potential for either a quick reclaim attempt of ~225.5 or a probe of ~219.2 with eyes on 214.84 if pressure builds. The externally flagged 233 resistance and 199/190/175 supports anchor the wider map, while IBD’s 214.84 pivot supplies a nearby litmus for the integrity of the breakout structure.
Base case: a 218.5–229.5 consolidation range, with directional breakouts contingent on closing strength through either 225.5 (upside) or 219.2 (downside). Bullish skew emerges if the 20-day is reclaimed and holds, putting 233 within reach; bearish skew emerges on a 50-day loss with momentum deterioration, focusing attention on 214.84 and, if that fails, the 199/190/175 staircase.
Editorial Statement
This analysis is for informational and educational purposes only and is based solely on the provided technical snapshot as of 2025-08-09 and the cited external sources. It does not constitute investment advice, a recommendation to buy or sell any security, or an offer to provide investment advisory services. Markets involve risk, including the potential loss of principal. Always perform your own due diligence and consider consulting a qualified financial professional before making investment decisions.