GOOGL Weekly Technical Analysis: Momentum Above $200 With Overbought RSI; Holding 197.95 Is Key
Executive Summary
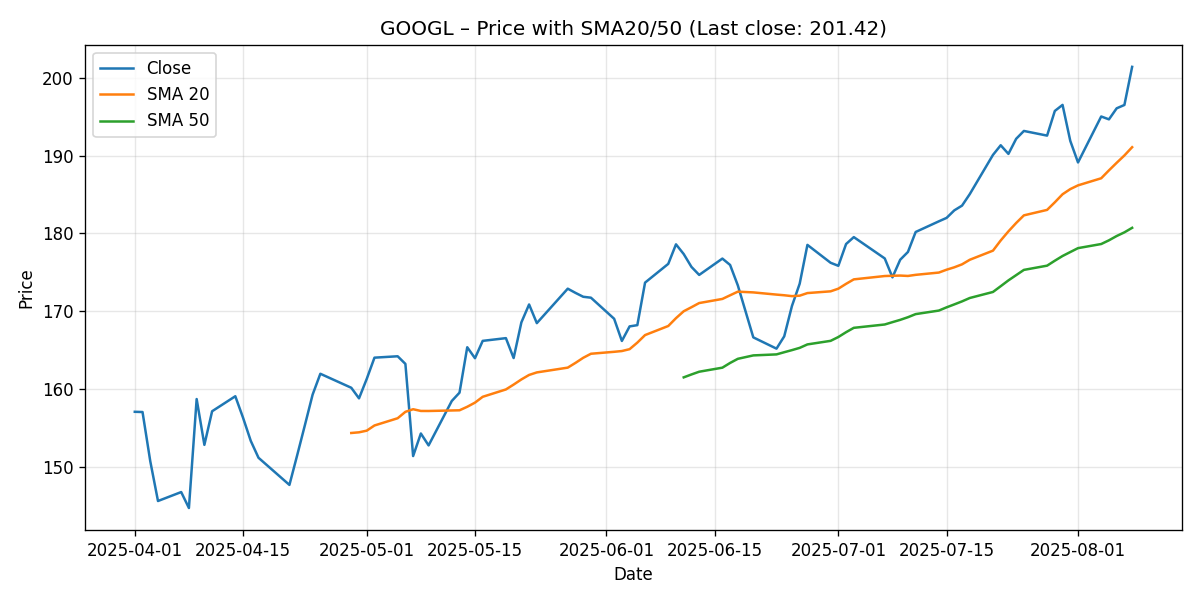
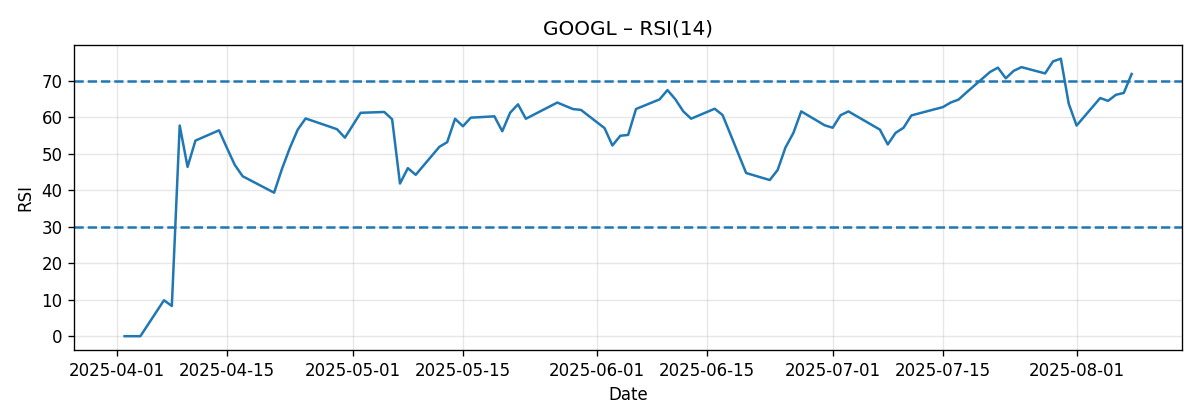
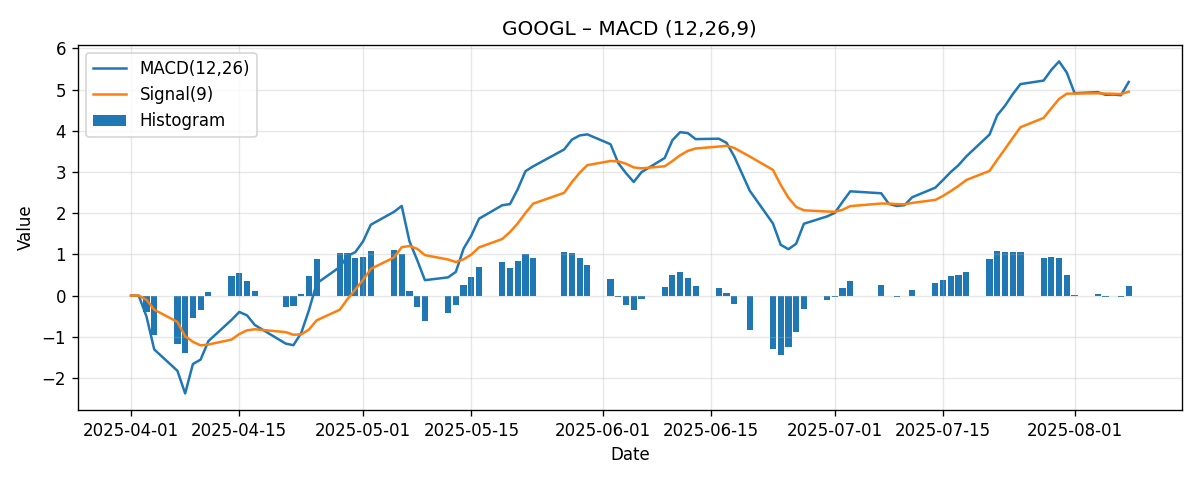
Alphabet (GOOGL) extended its winning streak, closing the week at 201.42, up 4.96% over the last seven days. Price is firmly above both the 20-day simple moving average (SMA20 at 191.09) and the 50-day simple moving average (SMA50 at 180.72). Momentum indicators confirm strength but also flag a near-term overbought condition: the 14-day RSI sits at 71.84 (above the typical 70 threshold), and MACD (12/26/9) remains bullish with a positive histogram (MACD 5.19 vs Signal 4.95).
- Last close: 201.42 (+4.96% week-over-week)
- RSI(14): 71.84 (overbought zone)
- MACD(12/26/9): 5.19; Signal: 4.95; Histogram: +0.24 (bullish momentum)
- SMA20: 191.09; SMA50: 180.72 (price above both; SMA20 also above SMA50)
Technically, the stock is in an established uptrend with a recent breakout above a well-publicized pivot at 197.95, as noted by Investor’s Business Daily: “Google recently cleared a cup-with-handle buy point at 197.95.” Maintaining price acceptance above that breakout level and above the 200 round figure would keep the momentum bias positive. However, the overbought RSI suggests that the stock could consolidate in the near term to digest gains.
Our base case for the coming week is a consolidation-to-upward-drift scenario with an expected trading range centered around the 200 area, using 197.95 as a tactical line in the sand. A decisive push higher could extend toward the low-200s, while a failure to hold 197.95 would increase the odds of a pullback toward the SMA20 near 191.
Weekly Market Context & Trend
The weekly context remained supportive for mega-cap tech and AI-exposed names, and GOOGL’s own narrative benefited from favorable sell-side sentiment tied to cloud and AI momentum. Reuters reported: “At least 27 brokerages raised their price targets on Google stock.” While that is fundamentally oriented rather than purely technical, it matters because aggressive PT revisions often accompany strong technical trends by stoking incremental dip-buying and reducing the supply of willing sellers near current prices.
At the same time, there are important policy and legal crosscurrents. Barron’s highlighted that an analyst, Anmuth, “maintains an Overweight rating on Alphabet with a $232 price target,” in a piece centered on how an antitrust remedy could affect platform economics: Google Will Soon Be Told How to End Its Monopoly. What That Means for Apple. And Investor’s Business Daily underscored the technical character of the move, noting the breakout: “Google recently cleared a cup-with-handle buy point at 197.95.”
These threads create a recognizable market context:
- Momentum-led advance supported by repositioning and upgrades.
- Potential headline risk around antitrust remedies that could briefly disrupt the trend, even if the intermediate structure remains constructive.
- Technically extended readings that often lead to sideways action or modest pullbacks before trend resumption.
Net-net, the trend remains bullish, but the tactical tape may alternate between short bouts of digestion and attempts to push to new cycle highs above the 200 handle.
Detailed Technicals
Price Action and Moving Averages
GOOGL closed the week at 201.42, firmly above both the 20-day and 50-day moving averages. The numerical relationships are important:
- Price vs SMA20: 201.42 vs 191.09 → approximately 5.4% above the 20-day average.
- Price vs SMA50: 201.42 vs 180.72 → approximately 11.4% above the 50-day average.
- SMA20 vs SMA50: 191.09 vs 180.72 → short-term trend indicator (SMA20) is above the intermediate trend indicator (SMA50), a constructive configuration.
Implications:
- Being 5%+ above the 20-day moving average signals a strong near-term impulse but also raises the probability of mean-reversion impulses, especially if momentum oscillators register overbought readings.
- The 200 level is a psychological milestone. Sustained trading above it strengthens the case that the prior breakout (197.95 per IBD) is transitioning from resistance to support.
- As a rule of thumb, the 20-day average (191.09) tends to be the first area where short-term pullbacks often stabilize within ongoing uptrends. The 50-day (180.72) is a deeper reference often tested after sharper corrections or when a trend is reassessing its slope.
RSI(14)
The 14-day Relative Strength Index prints at 71.84, just above the 70 threshold commonly associated with overbought conditions. Context matters: in strong uptrends, overbought RSI readings can persist; they are not, by themselves, a sell signal. Instead, they typically warn of two tactical outcomes:
- Sideways digestion that allows moving averages to catch up to price without major damage.
- Shallow retracements back toward the breakout area or the nearest moving average.
For GOOGL, with RSI at 71.84, the market is signaling strong momentum but decreasing marginal reward for late entries at current levels. If RSI cools toward the 55–65 zone while price holds above 197.95, that would corroborate healthy consolidation. A sustained RSI above 70 concurrent with price acceptance above 200 would keep the door open for incremental upside probes.
MACD (12/26/9)
MACD is another piece of the momentum story. The latest readings show:
- MACD Line: 5.19
- Signal Line: 4.95
- Histogram: +0.24 (difference between MACD and Signal)
This is a constructive, bullish configuration—MACD above Signal with a positive histogram—indicating that upside momentum is intact. The histogram’s positive but modest spread suggests momentum is still rising but not accelerating explosively; that often corresponds to a trend grinding higher with periodic pauses rather than a vertical spike.
As with RSI, the interplay is critical: if MACD begins to flatten while RSI stays elevated, it can signal a momentum plateau and increase the odds of a pause or mild pullback. Conversely, if price consolidates while MACD and RSI reset without breaking key supports (200/197.95/191), the stage can be set for the next leg higher.
Key Levels (Support and Resistance)
The following table organizes the most actionable levels derived from the snapshot data and the cited external technical note about the breakout level. These are areas to watch for reaction and potential shifts in control between buyers and sellers.
| Level (USD) | Type | Rationale | Relevance if Touched |
|---|---|---|---|
| 201.42 | Near-term pivot | Last close; immediate reference point for gap/continuation behavior | Acceptance above favors continuation; loss intraday may invite tests of 200 |
| 200.00 | Psychological | Round-number area; often flips from resistance to support in strong trends | Holding above bolsters momentum; repeated failures below can trigger fade |
| 197.95 | Breakout support | External reference: “Google recently cleared a cup-with-handle buy point at 197.95.” (IBD) | First important downside line-in-sand for breakout integrity |
| 191.09 | Dynamic support | SMA20; typical pullback target in an ongoing uptrend | Bounces here indicate trend health; decisive break raises consolidation risk |
| 180.72 | Deeper support | SMA50; intermediate trend gauge | Tests imply a deeper reset; holding keeps the bigger uptrend viable |
Scenario Analysis: Next-Week Pathways
Below are three path-dependent scenarios for the week ahead. These ranges are reasoned projections based on the current momentum state (price above SMAs, RSI overbought, MACD positive) and common tape behavior around psychological levels and recent breakout pivots. They are not certainties but rather frameworks to plan around.
Bullish Scenario (momentum persists)
Setup: Buyers defend the 200 area early in the week, RSI remains elevated but stabilizes, and the market shows “acceptance” above last week’s close. MACD histogram stays positive or marginally expands.
- Validation triggers: Early holds of 200–201; shallow dips bought swiftly; strong closes relative to intraday ranges.
- Projection: 206.0–209.5 during the week.
- Rationale: A 2–4% extension from the 200 handle is consistent with ongoing momentum where pullbacks are brief and demand steps in quickly. Momentum breadth is supported by price being >5% above the 20-day and >11% above the 50-day.
- Risk to this scenario: Failure to hold 200 on multiple attempts, or a sharp RSI reversal from >70 to sub-60 in a single session.
Most-Likely Scenario (consolidation with upward bias)
Setup: The stock oscillates around the 200 area, respecting the breakout level at 197.95 on dips and printing higher lows on intraday timeframes. RSI eases modestly toward mid-to-high 60s without losing trend integrity. MACD flattens to slightly positive.
- Validation triggers: Ranges compress around 199–203; closes near the top half of the daily range; lower wick demand at 198–200.
- Projection: 198.5–205.5 weekly trading range.
- Rationale: After a 4.96% weekly gain and with RSI >70, digestion is statistically common. Holding above 197.95 while staying near 200 can create a platform for later continuation.
- Risk to this scenario: Momentum re-acceleration without consolidation (tilting to the bullish scenario) or a failed hold of 197.95 (tilting bearish).
Bearish Scenario (failed breakout retest)
Setup: Sellers press the tape below 200 and then below 197.95, triggering stops from short-term breakout participants. RSI rolls decisively toward neutral; MACD histogram turns negative.
- Validation triggers: Inability to reclaim 200 on rebounds; strong close below 197.95; rising intraday supply on rallies.
- Projection: 193.0–197.5 during the week, with risk of a momentum extension toward the SMA20 (191.09) if selling accelerates.
- Rationale: The first major downside inflection is the 197.95 level. If broken, gravity often points toward the 20-day average (191.09) as the next area of interest. Given current distance from the SMA20 (~5.4%), the first test could be swift if the tape turns risk-off.
- Risk to this scenario: Fast reclaims of 197.95 and 200, indicating demand remains in control.
Comparative Outlook: How Our View Compares to External Predictions
We compare our technical stance with three external, link-cited viewpoints. Each reflects different lenses—fundamental, policy, and technical—and together they frame the broader narrative.
1) Reuters: Sell-Side Upgrades and AI/Cloud Tailwinds
Reuters reported: “At least 27 brokerages raised their price targets on Google stock.” This wave of positive revisions typically improves liquidity conditions for longs by anchoring higher expectations and lowering the immediate supply of shares for sale around current prices. Our technical view aligns directionally: price is above SMA20 and SMA50 with a bullish MACD and an overbought RSI, all consistent with a tape that institutions are willing to chase on dips.
Where we differ is scope and timeframe. The Reuters item is fundamentally oriented and suggests medium-term support, while our analysis is explicitly focused on the next week. Even when sell-side revisions are constructive, an overbought near-term oscillator often implies consolidation risk, which is why our base case calls for a 198.5–205.5 range rather than a straight-line continuation.
2) Barron’s: Antitrust Remedy and A High-Profile $232 Target
Barron’s wrote: “Anmuth maintains an Overweight rating on Alphabet with a $232 price target.” This perspective frames a constructive medium- to long-term outlook, while acknowledging the policy backdrop around potential antitrust remedies. From a technical standpoint, our work neither affirms nor refutes long-term price targets; instead, it flags that the current setup is extended near-term (RSI >70) and that tactical levels (200/197.95/191) will likely dictate next week’s tape.
We therefore align with the positive directional bias implicit in the Overweight rating, but we temper near-term expectations: over the next week, the more relevant battle is whether 197.95 holds on any pullback, not whether the stock reaches the 230s.
3) Investor’s Business Daily: Breakout Confirmation at 197.95
IBD noted: “Google recently cleared a cup-with-handle buy point at 197.95.” That level is now a center of gravity for near-term technical control. Our view strongly aligns here: the 197.95 breakout is the tactical fulcrum. Above it, the bias remains constructive; below it, odds rise for a test of the SMA20 at 191.09.
The slight difference is in our emphasis on momentum conditions: with RSI at 71.84 and a modestly positive MACD histogram, we anticipate either a controlled dip toward that level (to test buyer resolve) or a sideways drift above 200 before any renewed push higher.
Risk Factors & What Could Invalidate The Setups
Key risks that could alter next week’s trajectories include:
- Momentum Exhaustion: With RSI in overbought territory (71.84), even minor negative catalysts can prompt outsized reactions as short-term positions unwind. A swift RSI drop below 60 alongside a bearish MACD cross would undermine the bullish and base-case scenarios.
- Failed Breakout Retest: A decisive break and close below 197.95—the cited breakout level—could flip the script to downside probing. Invalidation for the bullish case would be multiple failed attempts to reclaim 200 after such a break.
- Macro or Policy Headlines: The antitrust remedy topic flagged in the Barron’s and IBD pieces represents headline risk. Any unexpected developments could override technicals for a session or more, introducing gap risk that leapfrogs support levels.
- Liquidity Pockets: After a strong weekly move (+4.96%), the order book can thin above new highs and around psychological levels. If liquidity is light and sellers appear, intraday reversals can be swift even without a fundamental catalyst.
- Correlation and Factor Shocks: While we are not introducing external market data here, it’s worth noting that mega-cap tech often trades with broader factor flows. A style or risk-off rotation can push price toward the SMA20 or SMA50 quickly.
Invalidation checkpoints for each scenario:
- Bullish scenario invalidation: A close below 197.95, especially if followed by lower highs under 200 the next day.
- Most-likely (consolidation) invalidation: An impulsive breakout above 205.5 with strong breadth (tilts bullish), or a decisive close below 197.95 (tilts bearish).
- Bearish scenario invalidation: Swift reclaimed closes back above 200 after a brief dip, coupled with a stabilizing RSI and positive MACD histogram expansion.
Putting It All Together: Tactics and Timing
Given the current configuration—price above both SMAs, RSI >70, MACD positive—the blend of evidence suggests respecting the uptrend while preparing for near-term digestion. Practically, next week’s watch-list is straightforward:
- Above 200: Look for consolidation and acceptance. If intraday pullbacks keep finding support in the 200–201 area, the market signals a willingness to build a new base of operations for potential extension toward 206–209.5.
- 197.95 Re-test: If price tags this level, it’s a high-information moment. Steady demand and higher lows afterward would imply a standard breakout back-test. Failure would hint at deeper probing toward the SMA20 (191.09).
- 191.09 (SMA20): Should the tape weaken materially, the SMA20 becomes the next critical decision area. Strong buyers there keep the intermediate trend intact; a break raises the probability of a larger reset, potentially toward the SMA50 (180.72) over a longer horizon.
Importantly, none of these thresholds are recommendations; they are reference points that describe how the tape is likely to behave around widely observed levels. The interaction with these lines often reveals the next chapter of the trend.
Methodology Note
This analysis uses standard technical indicators drawn from the supplied snapshot:
- Price and percentage change are from the provided 7-day window.
- SMA20 and SMA50 are the last available simple moving averages.
- RSI(14) captures momentum/overbought-oversold tendencies.
- MACD (12/26/9), Signal, and the derived Histogram indicate trend momentum and inflection.
We avoid incorporating unprovided external data. The only external references are the three linked articles, used to add context rather than to generate additional quantitative inputs.
Editorial Statement (Disclaimer)
This is a market commentary and educational technical analysis based solely on the provided snapshot and three cited articles. It is not investment advice, an offer, or a solicitation to buy or sell any security. Markets involve risk, including the risk of loss. Technical levels are reference zones, not guarantees. Always perform your own research and consider your objectives and risk tolerance before making trading or investment decisions.