Tesla (TSLA) Weekly Technical Analysis: Price Clears 20/50-Day Averages, Momentum Turns Constructive
All figures in USD. Data snapshot as of 2025-08-10.
Executive Summary
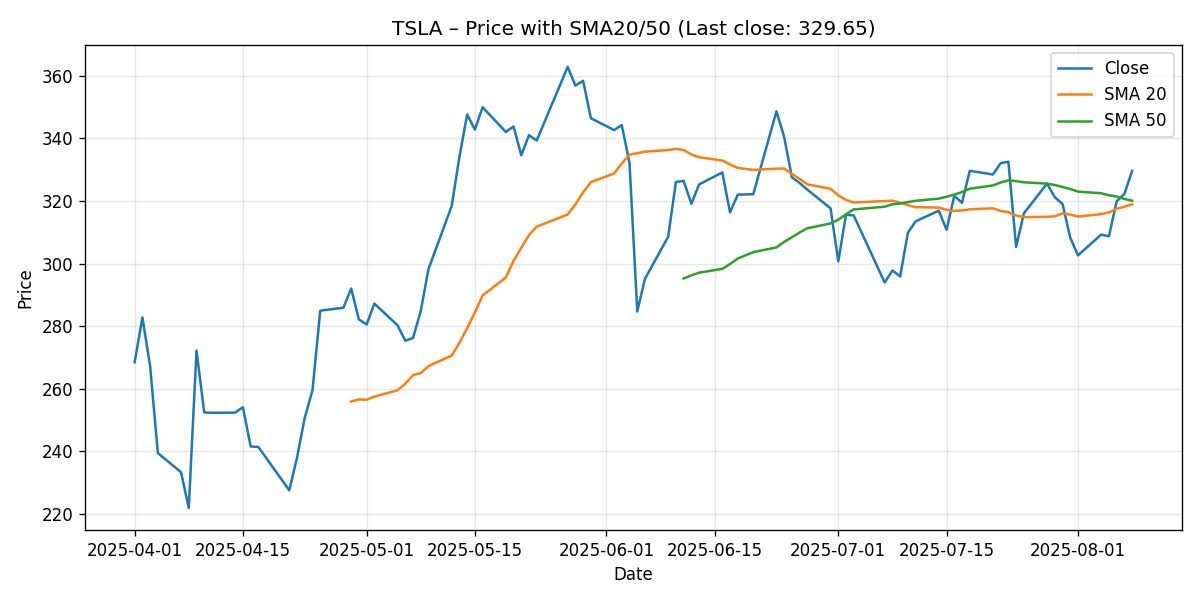
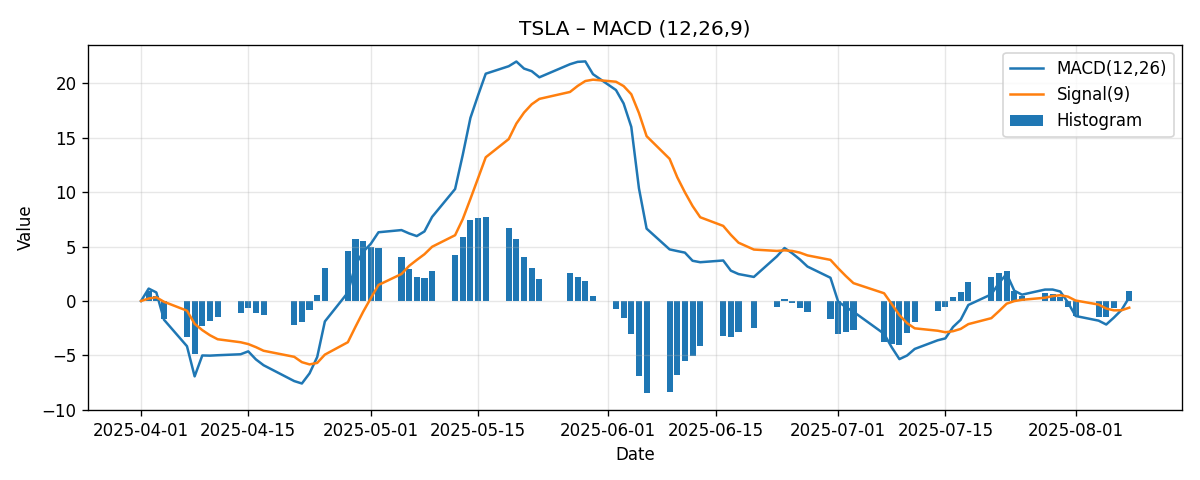
Over the past week, Tesla (TSLA) delivered a constructive technical performance, rising 6.94% and finishing at $329.65. Price ended the week above both the 20-day simple moving average (SMA20) at $318.97 and the 50-day simple moving average (SMA50) at $320.10. Momentum indicators have shifted in a supportive direction: the Relative Strength Index (RSI-14) sits at a neutral-bullish 56.44, while the Moving Average Convergence Divergence (MACD 12/26/9) line is positive at 0.331 and stands well above its signal line (-0.615), leaving a constructive histogram near 0.946.
- Last close: $329.65
- Week-over-week change: +6.94%
- SMA20: $318.97; SMA50: $320.10 (price above both)
- RSI-14: 56.44 (neutral-bullish, not overbought)
- MACD (12/26/9): 0.331 vs. signal -0.615 (positive spread ~0.946)
Externally referenced levels and narratives are mixed but useful for framing the next leg. According to Investors Business Daily, TSLA “remains in a new base with a traditional buy point at $367.71.” Barron’s notes that “the 200-day moving average near $330 might cap gains unless a new catalyst emerges,” which coincides with this week’s closing zone. MarketWatch highlights “approaching critical resistance around $380, near a key 61.8% Fibonacci retracement level.” These references suggest a band of overhead resistance between roughly $330 and $380, with $367.71 identified as a base breakout level in growth-stock methodology.
Our read for the upcoming week: the balance of signals leans constructive but still cautious given the immediate proximity to potential resistance near the $330 region (as cited by Barron’s) and the gap to higher resistance landmarks at $367.71 and $380. We map three scenario paths below, with a most-likely consolidation-to-grind-higher bias so long as price holds above the $320–$319 moving average zone.
Weekly Market Context & Trend
TSLA’s +6.94% weekly gain represents a notable rebound within a short seven-day window, propelling price back above two important short-term reference points: the 20-day and 50-day simple moving averages. In classical trend interpretation, price trading above these averages signals improving short-term trend health. At the same time, the SMA20 ($318.97) remains slightly below the SMA50 ($320.10), implying that while price action has recovered, the short-term moving-average structure has not yet flipped decisively into a strong uptrend where faster averages lead slower ones. This nuance matters for tactical traders who seek confirmation from the alignment of moving averages as well as from price itself.
Momentum conditions support the constructive tone. RSI-14 at 56.44 is comfortably mid-range, indicating neither exhaustion from overbought conditions nor the pressure associated with oversold readings. The MACD line’s position above both zero and its signal line typically accompanies upswings or early-stage recoveries in trend. Together, these indicator readings suggest the path of least resistance is upward in the near term, albeit with potential tests or pauses at nearby resistance landmarks.
It is also significant that external commentary has converged around potential resistance clusters ahead. Barron’s points to the 200-day moving average near $330 as a possible cap absent a fresh catalyst; TSLA’s close at $329.65 essentially places the stock right at that contested zone. Investors Business Daily marks a higher “buy point” at $367.71, while MarketWatch references a 61.8% Fibonacci retracement resistance around $380. Without endorsing any single method, we view these as waypoints: tactical traders will often sell into the first touch of such levels unless momentum drive is exceptionally strong, while medium-term swing traders may prefer to wait for a clean break and hold above resistance before committing.
Detailed Technicals (Price, SMA20/50, RSI-14, MACD 12/26/9)
Price vs. Moving Averages
TSLA’s last close of $329.65 sits:
- $10.68 above the SMA20 ($318.97), a gap of roughly +3.35%.
- $9.55 above the SMA50 ($320.10), a gap of roughly +2.98%.
In short-term trend analysis, price above both the 20- and 50-day averages is a constructive marker. It often implies that dip-buyers may step in near those moving averages, turning them into provisional support. However, confirmation requires that price tests and respects those levels on subsequent pullbacks. The SMA20 remains fractionally below the SMA50, which modestly tempers the strength of the setup, but the relative positioning of price versus these moving averages is more important for near-term direction.
What could improve this picture further? A brief consolidation above $320–$319, followed by a push and close well clear of the $330 area (which external commentary associates with the 200-day moving average), would increase the odds that the recent rally attempt morphs into a higher-high advance. Conversely, a swift rejection near $330 and a daily close back below both SMAs would reintroduce downside risk and suggest the bounce is fragile.
RSI-14 (56.44): Neutral-Bullish
With RSI-14 at 56.44, TSLA sits in a sweet spot for continued accumulation. This reading suggests positive momentum without the risk of an immediate mean-reversion selloff that can accompany overbought conditions. For context, many technicians consider 70 an overbought threshold and 30 an oversold threshold. TSLA is comfortably between these markers.
How to interpret the next move from here?
- If RSI pushes through the low 60s while price holds above the $320–$319 zone, it often reflects strengthening demand and increases the probability of testing higher resistance levels.
- If RSI rolls over toward the low 50s while price falls back under the moving averages, it would hint at a failed rally and a return to range-bound or corrective behavior.
Because RSI is a rate-of-change indicator, it tends to respond quickly to shifts in price vigor. The current mid-range reading gives the stock room to move higher before encountering momentum-based headwinds.

MACD (12/26/9): Line 0.331, Signal -0.615, Histogram ~0.946
The MACD reading paints a constructive momentum picture. With the MACD line above zero and above its signal line, the indicator implies that short-term momentum has turned positive. The histogram—computed as MACD minus Signal—sits near +0.946, a solid positive spread.
- Above-zero MACD: Consistent with uptrending or early-recovery phases.
- MACD above Signal: Indicates bullish momentum outpacing bearish momentum recently.
- Positive Histogram: Confirms the spread between MACD and Signal is favorable.
What to watch next:
- A continued widening histogram would typically indicate strengthening momentum, supportive of attempts to clear nearby resistance.
- A narrowing histogram or a bearish crossover (MACD falling below the Signal line) would warn of a pending consolidation or pullback.
Key Levels (Support/Resistance)
Below are the key levels we are tracking, combining objectively derived references (moving averages) with externally cited levels. We explicitly label the origin of each level.
| Level | Price | Type | Source / Rationale |
|---|---|---|---|
| Immediate Resistance Zone | ~$330 | Resistance | Barron’s notes the 200-DMA “near $330” could cap gains absent a catalyst. |
| Next Resistance (Buy Point) | $367.71 | Resistance | Investors Business Daily cites a traditional buy point at $367.71. |
| Upper Resistance (Fib Reference) | ~$380 | Resistance | MarketWatch cites resistance around $380 tied to a 61.8% Fibonacci retracement. |
| Near-Term Support (SMA50) | $320.10 | Support | Derived from data snapshot: 50-day simple moving average. |
| Near-Term Support (SMA20) | $318.97 | Support | Derived from data snapshot: 20-day simple moving average. |
| Psychological Round Number | $300.00 | Support | Common psychological level; not from external source, used as a trading heuristic. |
Interpretation: The immediate battle is at the ~$330 area. A decisive daily close above this region that holds on a subsequent retest would open a path toward the IBD buy point at $367.71. Should momentum persist, the next medium-term waypoint flagged by MarketWatch sits near $380. On the downside, the 50-day and 20-day moving averages around $320 and $319 compose the first support band. A breakdown below both would risk a rotation toward the $300 psychological round number.
Scenario Analysis: Next Week’s Paths and Price Projections
We outline three plausible tactical scenarios for the coming week, grounded in TSLA’s current positioning relative to its moving averages and momentum indicators. These are not predictions but structured frameworks for thinking about risk and opportunity.
Bullish Scenario
Premise: Buyers defend the $320–$319 zone on any early-week dip, and price quickly reclaims and holds above the ~$330 area that external commentary associates with the 200-day moving average. The MACD histogram remains positive or expands, and RSI pushes into the low 60s without showing signs of exhaustion.
- Trigger/Confirmation: Strong session(s) closing above ~$330 with follow-through and limited upper-wick rejection next day.
- Momentum Markers: MACD spread remains comfortably positive; RSI trends toward 60–62.
- Projected Range (next week): $340–$355, with a stretch objective toward $358–$362 if momentum accelerates.
- Invalidation: A reversal back below $320 that closes under both SMA20 and SMA50 would likely jettison this bullish path.
Rationale: Current indicator posture (MACD positive, RSI mid-50s) supports a modest upside extension, especially if the stock can absorb supply at the $330 region. The $367.71 IBD buy point is notable but may be ambitious for a single week unless a decisive catalyst emerges; thus, our near-term upside range stays conservative beneath that level.
Bearish Scenario
Premise: TSLA fails to overcome the ~$330 region and encounters swift selling pressure. Price falls back through $320–$319, flipping those moving averages from support to resistance. RSI slips back toward the low 50s, and MACD’s histogram contracts meaningfully or crosses toward negative territory.
- Trigger/Confirmation: A daily close below $318–$319 that is not reclaimed in the next session.
- Momentum Markers: RSI loses the mid-50s; MACD spread narrows toward zero.
- Projected Range (next week): $312–$318, with a risk extension toward $300–$306 if selling accelerates.
- Invalidation: A quick reclaim of $320–$330 and a strong close back above ~$330 would nullify the bearish skew.
Rationale: The tightening of price around key moving averages often sets up push-pull dynamics. A failure at $330 followed by a break below the SMA cluster would reintroduce supply and risk a momentum fade. In that scenario, traders often eye round-number psychology around $300 as the next deeper support checkpoint.
Most-Likely Scenario
Premise: Consolidation with an upward bias. Price respects the $320–$319 support band and grinds above $330 in fits and starts but lacks the impulse to immediately challenge higher resistance levels such as $367.71. Momentum readings stay constructive but not overheated.
- Trigger/Confirmation: Multiple sessions where pullbacks hold above SMA20/SMA50 and closes cluster modestly above $330.
- Momentum Markers: RSI fluctuates between 54–60; MACD stays positive though the histogram may ebb and flow.
- Projected Range (next week): $319–$345, with an upside probe to $348–$352 possible if buyers retain control late in the week.
- Invalidation: A decisive break below both SMAs that isn’t quickly reclaimed would shift the bias to the bearish scenario.
Rationale: This scenario fits the present evidence most closely. Stock is perched just beneath or around a potentially significant reference (~$330). Given the improving but not euphoric momentum, a controlled consolidation or gradual advance is a reasonable base case absent a new catalyst.
Comparative Outlook: Where External Predictions Align or Diverge
We consider three external viewpoints and map them to our framework:
1) Investors Business Daily (IBD): New Base, Buy Point at $367.71
Quote: “Stock remains in a new base with a traditional buy point at $367.71.” Source: Investors Business Daily.
How it fits: The IBD methodology’s buy point suggests that a valid breakout confirmation would be at $367.71, a level above the current price and above the immediate resistance cluster we discuss. Our weekly projections acknowledge this target but place it in a timeframe beyond one week unless momentum dramatically strengthens. We conceptually align with the idea that a durable breakout requires clearing a high bar; we simply temper the timing, given current proximity to $330, the mid-50s RSI, and MACD that is positive but not explosive.
2) Barron’s: 200-Day Moving Average Near $330 May Cap Gains
Quote: “The 200-day moving average near $330 might cap gains unless a new catalyst emerges.” Source: Barron’s.
How it fits: TSLA’s close at $329.65 places it squarely into this battleground. While we do not independently compute the 200-day moving average in this analysis, the cited level aligns with the practical reality that stocks often pause or churn when they first meet a widely watched long-term average. Our most-likely scenario of consolidation-to-gradual-advance reflects respect for this potential lid; the bullish scenario requires a solid close above this region with follow-through.
3) MarketWatch: Resistance Around $380 (61.8% Fibonacci Retracement)
Quote: “Approaching critical resistance around $380, near a key 61.8% Fibonacci retracement level.” Source: MarketWatch.
How it fits: The $380 reference marks a more distant resistance target. From a tactical standpoint, $380 sits well above our near-term weekly ranges and above the IBD buy point. We see this as a medium-term waypoint that could come into play if TSLA first clears and holds above the $330 area and subsequently surpasses $367.71. We differ in timeframe rather than in direction: the current indicator posture does not preclude a move toward $380, but we view it as a later-stage objective contingent on multiple intermediate confirmations.
Risk Factors & What Could Invalidate The Setups
Technical setups operate within a broader market and company-specific news flow. The following risks could disrupt the outlined scenarios:
- Headline sensitivity: TSLA is particularly responsive to product updates, executive commentary, regulatory developments, and competitive dynamics. Unexpected news can override technical levels and produce gap moves.
- Macro market tone: Shifts in interest rate expectations, equity risk appetite, or sector rotation can amplify or suppress TSLA’s momentum. A broad market pullback often weakens breakout attempts and accentuates downside follow-through.
- Volatility around widely watched levels: As Barron’s notes, long-term moving averages (e.g., near $330) can act as magnets, creating whipsaws. False breakouts or breakdowns are common in such zones.
- Momentum reversals: A rapid contraction of the MACD histogram, a bearish MACD crossover, or a drop in RSI back toward the low 50s/high 40s while price fails to hold the $320–$319 zone would weaken the bullish case.
- Liquidity and execution risk: Slippage and spreads can widen around key inflection points, particularly if moves occur outside regular trading hours.
Invalidation markers tied to our scenarios:
- Bullish invalidation: A daily close below both SMA20 ($318.97) and SMA50 ($320.10) that is not quickly reclaimed.
- Most-likely invalidation: A sustained failure at ~$330 followed by decisively lower highs and lower lows beneath the SMA cluster.
- Bearish invalidation: A quick reclaim and strong close above ~$330, with follow-through buying the next session.
Putting It All Together
TSLA’s weekly rebound has reset the near-term technical backdrop to constructive. Price sits above both the 20-day and 50-day moving averages, RSI is neutral-bullish at 56.44, and MACD is positive with a healthy spread over its signal. These elements collectively argue for a bias toward stabilization and potential continuation higher, provided the stock can absorb overhead supply near ~$330.
External perspectives frame the path: Barron’s identifies ~$330 as an important long-term average that could temporarily cap the move; IBD places the formal breakout pivot at $367.71; MarketWatch flags a higher resistance waypoint near $380. Our weekly lens reconciles these by proposing a stepwise progression: first consolidate and hold above the SMA band; then demonstrate control above ~$330; then consider prospects of a run toward the mid-$300s. Only after those steps should traders seriously entertain the higher landmarks at $367.71 and $380.
In practical terms, risk management around the $320–$330 corridor is crucial. Respect for moving averages as near-term support, coupled with disciplined responses to any rejection at the ~$330 region, can help navigate the coming week’s likely ebb and flow. Absent a new catalyst, the market may prefer to test conviction through consolidations rather than immediate vertical advances.
Editorial Statement
This analysis is for informational and educational purposes only and is based solely on the provided data snapshot and the specific external sources linked herein. It is not investment advice, an offer, or a recommendation to buy or sell any security. Markets are uncertain and can move rapidly for reasons not captured by technical indicators. Always perform your own due diligence and consider consulting a licensed financial professional before making trading or investment decisions. Past performance and technical patterns are not guarantees of future results. You are responsible for your own trading and risk management decisions.
Appendix: Indicator Reference
- SMA20 ($318.97) and SMA50 ($320.10) are short-term trend gauges; price above both suggests improving momentum.
- RSI-14 at 56.44 signals a neutral-bullish regime—room to rise before typical overbought thresholds.
- MACD 12/26/9 at 0.331 with signal at -0.615 yields a positive histogram near 0.946, indicating constructive momentum.
As with all technical tools, these indicators are best used in combination and in context with clearly defined risk parameters.