JPM Weekly Technical Analysis: Neutral Momentum as Price Sits Between SMA20 and SMA50; Scenarios for the Week Ahead
Executive Summary
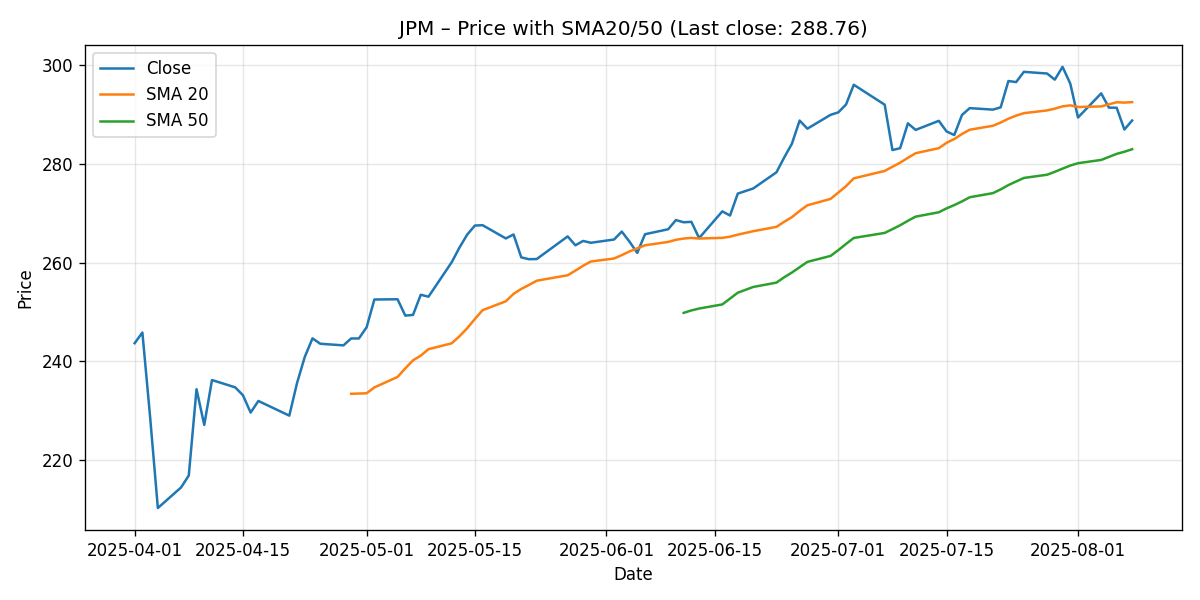
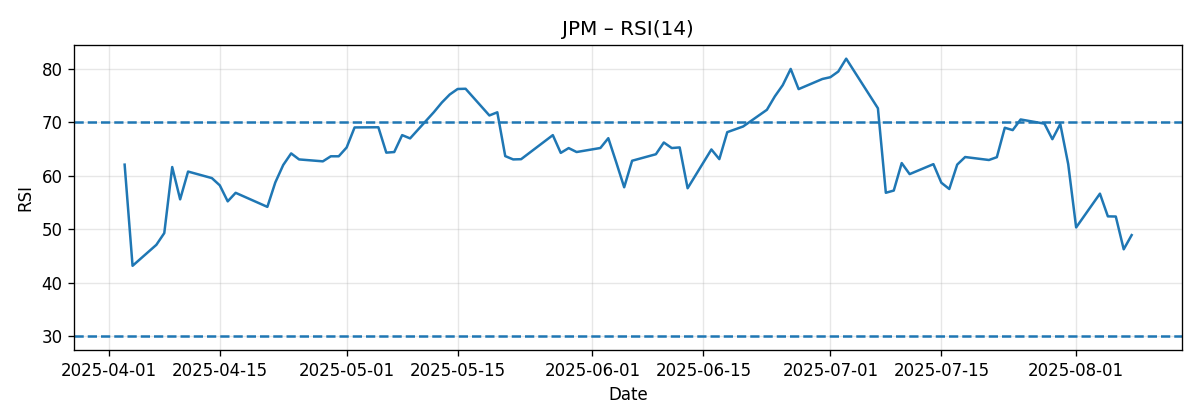
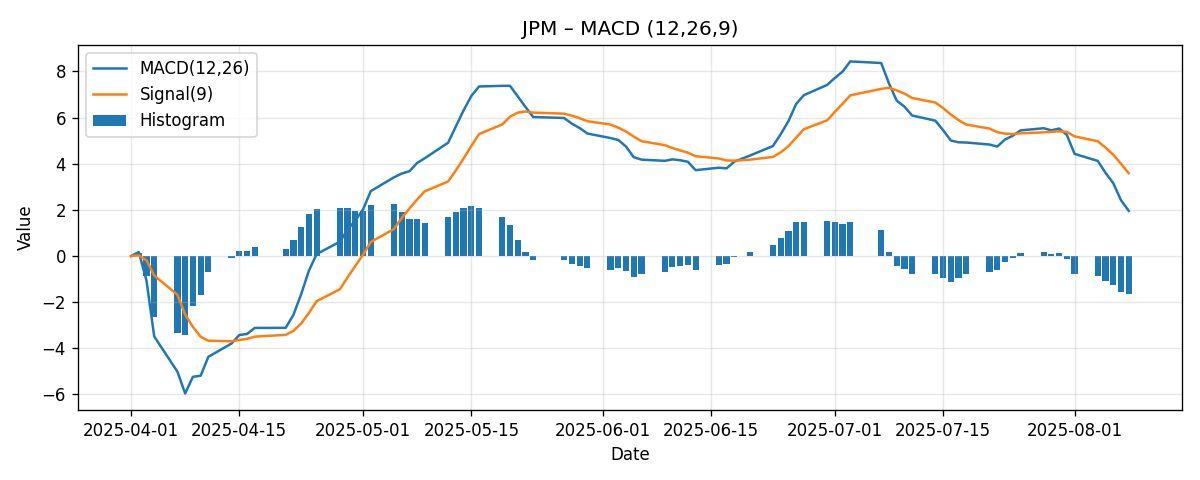
JPMorgan Chase & Co. (JPM) closed the week at 288.76, down 2.52% over the last seven-day window captured in the snapshot. The short-term technical picture has transitioned to a balanced-to-cautious posture: price finished below the 20-day simple moving average (SMA20) of 292.49 while remaining above the 50-day simple moving average (SMA50) of 282.95. This configuration is consistent with a market that has lost near-term momentum but retains a constructive medium-term bias. Momentum indicators underscore that nuance: the 14-period RSI printed 48.92 (neither overbought nor oversold), while the MACD line at 1.96 sits below its signal line at 3.59, leaving a negative histogram around -1.63 that signals waning near-term momentum rather than a confirmed downtrend.
In practical terms, the week’s pullback returned price to a zone that often produces decision points. With the SMA20 acting as immediate overhead reference and the SMA50 functioning as the first notable downside reference, traders are likely to key off a re-acceptance above 292.5 against a potential drift toward 283 if weakness persists. Given that the SMA20 remains above the SMA50—an alignment typically associated with an intact intermediate uptrend—the burden of proof sits with bears to force a decisive breakdown below the SMA50.
Our base case for the coming week is range-oriented price action between support near the SMA50 and resistance around the SMA20, with directional follow-through hinging on whether buyers can reclaim and hold above the SMA20 early in the week. We outline three scenario paths with explicit ranges:
- Bullish case: recovery toward 294–300 if price reclaims and holds above 292.5.
- Bearish case: fade toward 280–285 if sellers defend 292.5 and price slides through 283.
- Most-likely case: consolidation between 283–295 as momentum resets.
Longer term, several external analysts continue to see upside toward 325 (see links in Comparative Outlook). That target sits roughly 12–13% above the latest close. We largely align with that constructive medium-term stance, but the short-term picture—price below SMA20, RSI around 49, and a negative MACD histogram—argues for patience while momentum stabilizes.
Weekly Market Context & Trend
Over the last seven-day observation window, JPM slipped 2.52%, closing at 288.76. Pullbacks of this magnitude are common inside ongoing trends and often serve to test moving averages that many market participants track. What stands out this week is the positioning between moving averages:
- Price is below the SMA20 (292.49) by approximately 3.73 points, or about 1.28%.
- Price is above the SMA50 (282.95) by approximately 5.82 points, or about 2.06%.
- The SMA20 is above the SMA50, which typically signals that the medium-term uptrend remains intact even as short-term momentum fades.
This juxtaposition—below the faster average, above the slower average—often characterizes a transition or pause phase. It can resolve in one of two primary ways: a) buyers regain control, pushing price back above the SMA20 and reasserting the short-term uptrend, or b) sellers extend their advantage enough to drag price into the SMA50, forcing a deeper momentum reset and testing the resilience of intermediate-term demand.
Momentum indicators corroborate this “pause” characterization. The RSI14 near 48.92 is essentially neutral, situated just under the 50 midline where momentum tips from bullish to bearish. Meanwhile, the MACD line (1.96) remains above zero but below the signal line (3.59), implying that while the broader trend bias is still positive, the near-term impulse has turned soft. It is a classic recipe for a week of testing and probing rather than decisive one-way travel.
Given the widely followed nature of round-number levels and moving averages, the SMA20 approximately around 292.5 is a natural near-term inflection: recapture and acceptance above this area would likely encourage dip buyers, whereas repeated failure beneath it leaves the door open for a gravity test toward the SMA50 near 283.

Detailed Technicals (Price + SMA20/50, RSI14, MACD 12/26/9)
Price vs. SMA20 and SMA50
Price finished the week at 288.76, staging a 2.52% decline over the measured period. Against the key moving averages:
- Distance to SMA20: -3.73 points (approximately -1.28%).
- Distance to SMA50: +5.81 points (approximately +2.06%).
- Relative alignment: SMA20 (292.49) > SMA50 (282.95), which typically reflects a positive medium-term structure.
The combination of price below SMA20 and above SMA50 often suggests a near-term digestion within a still-healthy trend. In many cases, such configurations coincide with choppy trading as market participants evaluate whether the short-term pullback is a buyable dip or a harbinger of a deeper mean reversion toward the 50-day average. The 20-day average can act as dynamic resistance in the immediate term, especially following a weekly decline, while the 50-day average provides the first notable support reference where buyers might defend trend integrity.
Two practical observations follow from this setup:
- Should JPM reclaim and hold above the SMA20 early in the week, it would mark a quick reacceleration signal and increase the probability of a run toward the upper end of our projected bullish range. Sustained closes above the SMA20 often precede attempts to extend toward prior swing highs, though we refrain from speculating on any specific prior highs in the absence of those data in the snapshot.
- Conversely, if price remains capped beneath the SMA20, intraday rallies may fade into that average, and a subsequent drift into the SMA50 could materialize. The first meaningful test of 282.95 would be a pivotal moment for bulls to demonstrate ongoing control.
RSI14: Neutral, with Slight Downside Tilt
The 14-period Relative Strength Index stands at 48.92, essentially dead-center between common momentum extremes. RSI in the 45–55 corridor rarely offers a strong directional edge; rather, it signals a market in balance, with recent selling pressure insufficient to create oversold conditions and recent buying insufficient to sustain overbought status. In this context, RSI supports the idea of range-trading behavior unless and until a catalyst nudges momentum in either direction.
From a tactical perspective, an RSI push back above 50 and trending higher would likely coincide with a price move reclaiming the SMA20—an alignment that would add confidence to the bullish scenario. On the other hand, a slide of RSI into the low-to-mid 40s would be consistent with a test of the SMA50. It is worth underscoring that RSI is a momentum indicator, not a timing tool by itself; it becomes most effective when used alongside structure (moving averages, support/resistance) to frame risk.

MACD (12/26/9): Positive but Below Signal, Histogram Negative
The MACD line prints 1.96 versus a signal line at 3.59, leaving the histogram negative by approximately -1.63. This indicates that while the overall MACD remains above zero (consistent with a broader uptrend bias), the short-term impulse has weakened as the MACD line sits below its signal. In plain terms, we have a slowdown rather than a full-blown trend reversal signal.
Key inferences from this MACD structure:
- MACD above zero: Underlying medium-term strength remains credible.
- MACD below signal: Near-term momentum is soft, which often corresponds with rallies encountering resistance at nearby moving averages (here, the SMA20).
- Negative histogram: Reinforces the idea that bulls need to reassert momentum before a push to fresh higher ranges becomes probable.
As with RSI, a positive inflection in the histogram—i.e., the MACD line converging back toward or crossing above the signal—would usually align with price acceptance above the SMA20. Absent such a turn, we should respect the risk of mean reversion toward the SMA50.

Key Levels (Support/Resistance)
Based on the provided snapshot, the most objective reference points for the coming week are the 20-day and 50-day moving averages, plus the latest close as the immediate pivot. The table below lists these levels, their type, why they matter, and what a break could imply:
| Level | Type | Rationale | Implication if Broken |
|---|---|---|---|
| 292.49 | Resistance (near-term) | SMA20 sits above current price; often acts as dynamic resistance after a pullback. | Close and hold above improves odds of trend resumption; opens path toward upper end of bullish scenario range. |
| 288.76 | Pivot | Latest close; often used as a near-term reference to gauge buyer/seller control in the following session(s). | Holding above intraday is a minor positive; losing it with momentum raises risk of a test lower. |
| 282.95 | Support (first) | SMA50 below price; the first notable intermediate-term support reference. | Decisive break undermines medium-term structure and elevates risk of a deeper pullback. |
These levels are not guarantees of support or resistance, but they are widely tracked and can frame expectations for where supply and demand may concentrate next week. Given the configuration, the SMA20 is the first battleground overhead; the SMA50 is the first meaningful defense line below.
Scenario Analysis (Bullish / Bearish / Most-Likely)
Bullish Scenario
Premise: Buyers recapture the SMA20 (~292.49) early in the week and convert it from resistance into support on closing bases. Momentum strengthens as RSI pushes back above 50 and the MACD histogram begins to recover toward zero.
- Trigger: Sustained trade and preferably a daily close above 292.5.
- Projection: 294–300 range for the week, with intraday excursions possible.
- Logic: Reclaiming the SMA20 often precedes attempts to expand ranges higher. With the SMA20 still over the SMA50, the broader structure would support follow-through buying barring adverse macro shocks.
Risk to this scenario: Repeated intraday probes above 292.5 that fail and reverse would suggest supply still dominates near the SMA20, thereby raising the probability of reverting to the Most-Likely or Bearish paths.
Bearish Scenario
Premise: The SMA20 rejects price rallies. The negative MACD histogram persists, and RSI slips further below 50, reflecting a lethargic bid. Sellers press price toward the SMA50.
- Trigger: Multiple rejections beneath 292.5 followed by a decisive push below 288.8 and continued downside interest toward 283.
- Projection: 280–285 range for the week, with 282.95 (SMA50) acting as a focal test.
- Logic: In a soft-momentum tape, the path of least resistance can be lower into the next strong reference (SMA50). A sustained break below the SMA50 would weaken the intermediate structure.
Risk to this scenario: A quick recovery above 292.5 would neutralize the bearish bias by signaling that dip buyers remain active and capable of absorbing supply.
Most-Likely Scenario
Premise: Consolidation continues as the market digests the prior week’s decline. Price oscillates between the SMA50 as support and the SMA20 as resistance while RSI hovers around the mid-40s to low-50s. The MACD histogram stabilizes but remains near flat-to-negative.
- Trigger: Early-week balance with neither side showing force beyond the moving average bands.
- Projection: 283–295 range, punctuated by mean-reversion swings around 288–292.
- Logic: The technicals portray an indecisive market—neutral RSI, positive MACD above zero but below signal, and price boxed between two key averages. Such conditions tend to produce range trading until a catalyst breaks the stalemate.
As always, these scenarios are not certainties. They are frameworks for thinking about how price may react around visible references, helping readers structure expectations and risk in a disciplined way.
Comparative Outlook: External Predictions and How Our View Aligns/Differs
Several external analyst updates highlight a constructive medium-term view for JPM with a common target of 325:
- Bank of America (BofA) via Investing.com: “BofA raised its price target on JPMorgan to $325 from $300.” Source
- Wells Fargo via MarketBeat: “Wells Fargo raises JPM price target to $325, keeping Overweight.” Source
- Nasdaq.com (Wells Fargo/Mike Mayo): “Mike Mayo from Wells Fargo set a price target of 325.0 for JPM.” Source
At a closing price of 288.76, 325 implies roughly 12–13% upside. Our take:
- Alignment on intermediate trend: We broadly agree that the intermediate structure remains positive, evidenced by SMA20 > SMA50 and MACD > 0. These are classic hallmarks of an underlying uptrend.
- Short-term caution: Where we add nuance is the very near term. Price is currently beneath the SMA20, RSI is neutral at 48.92, and the MACD line is below its signal line. These elements argue for a possible consolidation or additional testing before a renewed advance. In other words, the path to 325 may be intact on a multi-week/multi-month horizon, but the next week looks more balanced than directional.
- Risk management emphasis: A patient approach makes sense when price sits between key averages with mixed momentum. If the SMA20 is reclaimed and held, our short-term posture would tilt more assertively in line with the bullish external targets’ spirit, albeit those targets address a longer horizon than a single week.
In sum, we generally align with the constructive longer-term analyst outlook, but we differentiate on timing. The current near-term technical mix—soft momentum and resistance nearby—suggests a week where tactical execution matters more than broad directional conviction.
Risk Factors & What Could Invalidate The Setups
Technical setups are probabilistic, and several factors could invalidate or materially alter the scenarios outlined above:
- Momentum fails to stabilize: If the MACD histogram continues to expand negatively and RSI dives meaningfully below 45, it would indicate momentum deterioration beyond a simple pause, elevating the odds of the Bearish scenario.
- Decisive break of SMA50: A clean and sustained break below 282.95 would dent the intermediate structure that currently supports the longer-term bullish view. Such a break could force reassessment of downside risk and delay any attempt to move toward external targets like 325.
- Sharp, catalyst-driven gap moves: Unforeseen headlines, sector developments, or macro surprises can gap price through nearby references, negating the tactical edge of incremental levels like SMA20 and SMA50. In those cases, waiting for post-gap structure to form often becomes the higher-quality play.
- Failed breakouts: Even a strong early-week push above 292.5 that reverses and traps new longs could reset momentum lower short term. Watching for confirmation (such as a daily close and follow-through) helps avoid the whipsaw risk.
Note: Our snapshot does not include volume, volatility, or multi-timeframe price history, all of which can materially influence conviction. Absence of these inputs argues for modest confidence bands around any weekly projection and an emphasis on flexible risk management as new data arrive.
Editorial Statement (Disclaimer)
This analysis is for informational and educational purposes only and reflects a technical view based solely on the provided snapshot and the three cited external links. It is not investment advice, an offer, or a solicitation to buy or sell any security. Markets are uncertain; all scenarios and projections are illustrative, not guarantees. Always conduct your own research and consider your risk tolerance, time horizon, and investment objectives. If needed, consult a licensed financial professional before making trading or investment decisions.
Appendix: Calculations and Observations
For readers who prefer explicit calculations and derived metrics, here is a concise recap of the math referenced above:
- Weekly percent change: -2.52% (provided).
- Distance to SMA20: 288.76 – 292.49 = -3.73 points, approximately -1.28% relative to SMA20.
- Distance to SMA50: 288.76 – 282.95 = +5.81 points, approximately +2.06% relative to SMA50.
- RSI14: 48.92 (neutral zone; neither oversold nor overbought).
- MACD vs signal: 1.96 vs 3.59; histogram ≈ -1.63 (negative, indicating near-term momentum softness).
Taken together, these numbers depict a market pausing within an otherwise constructive intermediate backdrop. The key tactical question for the coming week is whether price can re-establish acceptance above the SMA20; if yes, upside exploration is favored, and if not, the SMA50 becomes the likely magnet.
Actionable Takeaways (Process-Oriented)
While we refrain from making prescriptive recommendations, the following process-oriented takeaways may help readers approach the week with structure:
- Define bias by reference: Above 292.5 on a closing basis, incrementally bullish; below 292.5 but above 283, neutral-to-range-bound; below 283, cautious with risk of downside extension.
- Watch momentum confirmation: A turn higher in RSI (sustained above 50) and a narrowing MACD histogram would complement any price-based reclaim of the SMA20.
- Respect the 50-day: In many uptrends, the first test of the SMA50 attracts responsive buyers. If that does not happen, it is a message to reduce short-term risk assumptions.
Ultimately, discretion and flexibility will matter more than stubborn conviction in a week where both bulls and bears have defensible arguments, and the market is poised to reward whichever side proves capable of winning the SMA20/SMA50 tug of war.