BAC Weekly Technical Analysis: Pullback Below Key Averages With Mixed Momentum Signals
Executive Summary
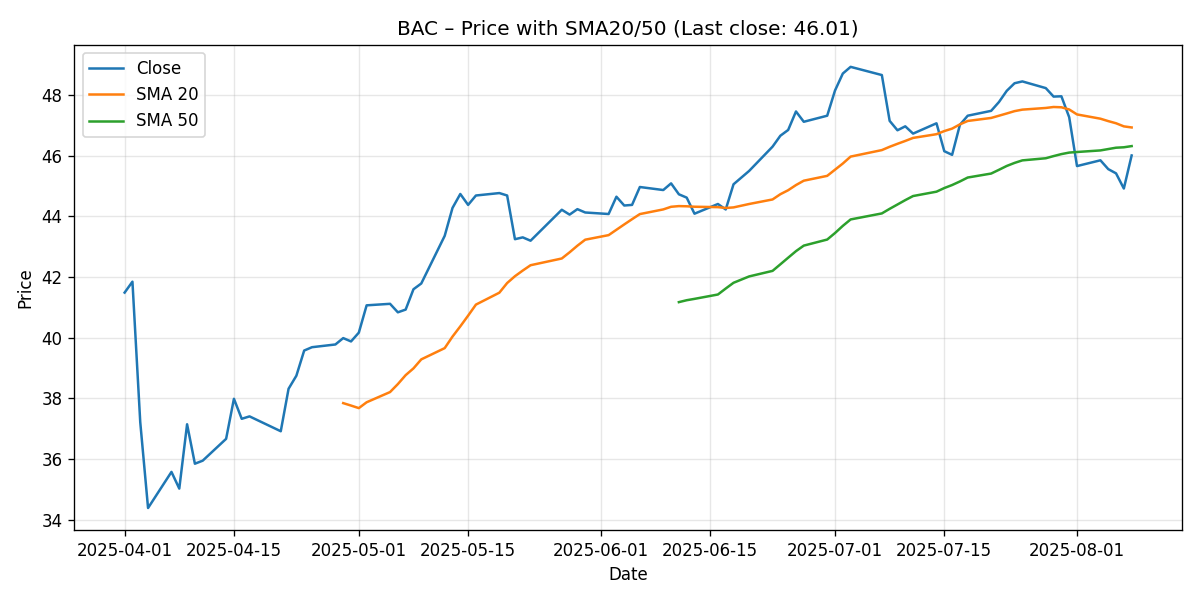
This week’s technical read on Bank of America (BAC) points to a short-term pullback within what still appears to be a broader, constructive intermediate trend. The price closed at 46.01, down approximately 2.67% week-over-week. Momentum gauges softened: the 14-day RSI sits at 45.38 (sub-50, yet far from oversold), and MACD is negative and below its signal line, highlighting a cautious tone. Crucially, spot is now below both the 20-day simple moving average (SMA20 at 46.93) and the 50-day simple moving average (SMA50 at 46.32). However, SMA20 remains above SMA50, a classical configuration that often characterizes an intermediate uptrend experiencing a near-term cooling phase.
Key takeaways:
- Last close: 46.01; week-over-week change: -2.67%.
- Price sits below SMA20 (46.93) and SMA50 (46.32); SMA20 remains above SMA50.
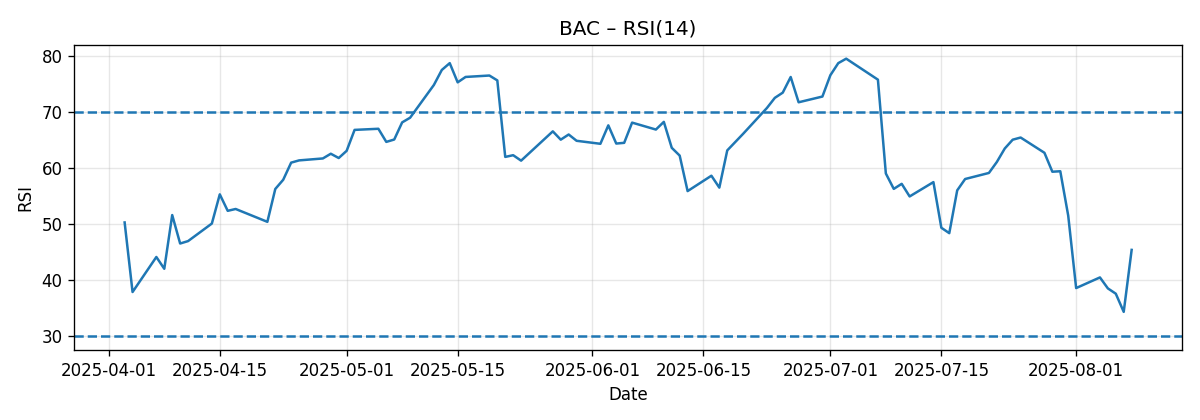
- RSI(14): 45.38; neutral-to-soft momentum; not oversold.
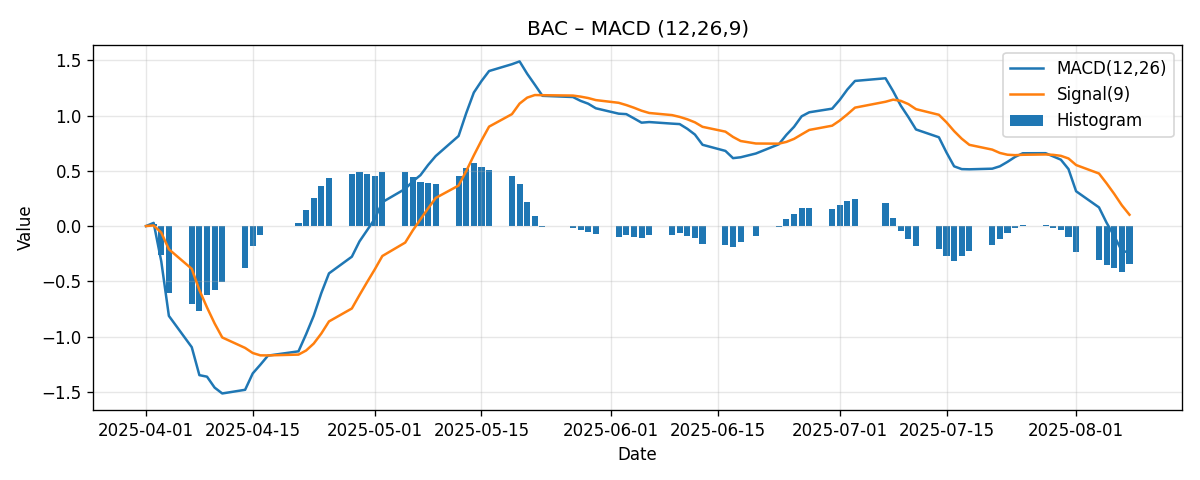
- MACD(12/26/9): -0.239 vs signal 0.103; momentum negative; histogram is below zero.
- Near-term technical bias: neutral-to-cautiously bearish into next week unless price reclaims the SMA50.
- Key resistance: 46.32 (SMA50) and 46.93 (SMA20). Near-term pivot: 46.00 (last close). Heuristic supports: 45.00 and 44.00 as psychological areas.
- Base-case next-week range: 45.20 to 46.80, with a tilt toward mean reversion attempts if 46.32 is reclaimed on a closing basis.
Overall stance: Our interpretation is that BAC is consolidating after a prior advance, with the intermediate setup still constructive while the short-term picture has deteriorated modestly. The next decisive technical tell will be whether the stock can recapture the SMA50 early in the coming week.
Weekly Market Context & Trend
The seven-day snapshot shows BAC slipping 2.67% week over week, a controlled drawdown rather than a disorderly sell-off. The pullback carried price below both the SMA20 and SMA50. In isolation, that typically signals short-term sellers have the upper hand. Yet the fact that the SMA20 remains above the SMA50 indicates the medium-term trend has not fully reversed; instead, we are most likely witnessing a routine consolidation or pullback phase within an ongoing larger up-move.
With RSI in the mid-40s, momentum is neither emphatically weak nor strong—it’s subdued. The negative MACD reading, combined with MACD being under its signal line, corroborates that near-term trend pressure is downward or at least indecisive. Against that, price is not far below the SMA50: at 46.01 versus a 46.32 SMA50, the gap is modest. If buyers can stabilize around the current pivot and press back above the SMA50, the near-term tone could shift quickly toward neutral or even constructive again.
For context within this specific 7-day window, we see:
- Price action: a controlled pullback that tested and fell below intermediate references (SMA20/50).
- Momentum: RSI sub-50 and MACD negative, consistent with short-term caution.
- Trend alignment: SMA20 > SMA50 suggests the broader trend has not flipped bearish; the current action is more likely a pause or retracement.
In short, the weekly context points to a battleground near the SMA50. A recovery above that level would argue for stabilization; ongoing failure beneath it and beneath the SMA20 keeps the near-term pressure on the downside.
Detailed Technicals
Price vs. Moving Averages (SMA20 and SMA50)
Spot: 46.01
- SMA20: 46.93 — price is approximately 0.92 below the SMA20, or about -1.97% beneath this near-term trend gauge.
- SMA50: 46.32 — price is roughly 0.31 below the SMA50, or about -0.66% beneath the intermediate trend gauge.
Interpretation:
- Being below both SMA20 and SMA50 confirms short-term weakness. The relatively small deficit to the SMA50, however, implies that a single strong session could reclaim that line.
- The SMA20 remains above the SMA50, which commonly signals that the underlying intermediate trend is still up. Pullbacks in such configurations can present opportunities if the stock stabilizes and reclaims moving average resistance.
- The confluence area between the SMA50 (46.32) and the SMA20 (46.93) now acts as a resistance band. Clearing the lower edge (SMA50) is the first step; clearing the upper edge (SMA20) would be needed to re-establish short-term momentum back in the bulls’ favor.
Relative Strength Index (RSI14)
RSI(14): 45.38
- This is below the neutral 50 threshold, hinting at mild bullish fatigue or a modest bearish tilt in the short run.
- RSI is not near the classical oversold threshold (30), so there is no immediate oversold signal or obvious contrarian setup based on RSI alone.
- In the context of a larger uptrend (as implied by SMA20 > SMA50), an RSI in the 40s often coincides with consolidation pauses that can resolve either way, depending on whether price reclaims key moving averages.
MACD (12/26/9)
MACD line: -0.239; Signal line: 0.103; Histogram (MACD minus Signal): approximately -0.342.
- MACD below zero: short-term momentum is negative.
- MACD below its signal line: bearish momentum bias persists.
- The negative histogram underscores that downside momentum has the edge for now. A shrinking negative histogram in the coming sessions would be an early tell that bearish pressure is easing.
Key Levels (Support and Resistance)
The following levels are derived from the provided moving averages, the last closing price, and common technical heuristics (notably, psychological round numbers). They are reference points rather than guarantees and should be used in conjunction with price action confirmation.
| Level | Type | Rationale | Status vs. Last Close (46.01) |
|---|---|---|---|
| 46.93 | Resistance | SMA20 — upper bound of the current resistance band | Above |
| 46.32 | Resistance | SMA50 — first resistance to reclaim | Above |
| 46.00 | Pivot | Last close area — near-term balance point | At |
| 45.00 | Support (heuristic) | Psychological round number below spot | Below |
| 44.00 | Support (heuristic) | Secondary psychological level | Below |
Traders often monitor the interplay between price and the moving averages. In the near term, 46.32 (SMA50) is the gatekeeper: failure to reclaim it keeps the edge with sellers; a decisive break above it invites tests of 46.93 (SMA20). On the downside, 45.00 is a clean psychological step where dip demand could reappear if the pullback deepens.
Scenario Analysis: Next-Week Projections
Given the current positioning below the SMA20/50 and momentum readings, we outline three plausible paths for the coming week. These are scenario ranges based on the present technical context; they are not guarantees and can be superseded by new information or outsized market moves.
1) Bullish Rebound Scenario
- Trigger conditions: Early-week reclaim of 46.32 (SMA50) on a closing basis, accompanied by a firming RSI (toward or above 50) and a stabilizing MACD histogram (less negative day by day).
- Rationale: Short-term pullbacks within an intermediate uptrend often find their footing near the 50-day average. A swift recapture attracts dip buyers and momentum strategies.
- Projected range: 46.35 to 47.40 for the week. Stretch tests toward the SMA20 at 46.93 are likely, and an extension through that level can open a path toward the upper-46s to low-47s.
- Invalidation: A failure back below 46.00 after a breakout attempt, or a sharply deteriorating MACD histogram, would weaken this scenario.
2) Bearish Continuation Scenario
- Trigger conditions: Rejection below 46.32 persists; RSI remains under 50 and drifts lower; MACD histogram stays negative or expands.
- Rationale: With price below both the SMA20 and SMA50 and week-over-week momentum soft, sellers could press to probe deeper supports.
- Projected range: 44.80 to 45.80. A move toward the 45.00 psychological level is a reasonable objective if sellers retain control. A clean break below 45.00 could expose the mid-44s.
- Invalidation: A decisive daily close back above the SMA50 would argue that the downside impulse is losing traction.
3) Most-Likely Base Case: Rangebound Stabilization
- Setup: A tug-of-war around the 46.00 pivot as participants gauge whether the pullback is complete. The SMA50 at 46.32 caps initial rallies; 45.00 underpins pullbacks.
- Projected range: 45.20 to 46.80. This envisions oscillations around the SMA50 ceiling with dips finding interest before 45.00.
- Path to resolution: The first decisive daily close above 46.32 shifts the bias toward testing 46.93; a daily close below 45.00 would tilt the week toward the bearish scenario.
Comparative Outlook: How Our View Stacks Up Against External Calls
We compare our near-term, data-driven interpretation with three external technical perspectives. Each external source is paraphrased or quoted briefly below, followed by an explanation of alignment or divergence given our snapshot readings.
1) Investors.com: Buy Range Up to 50.38
External view: Investors.com notes that “Bank of America… entering a buy range up to 50.38.”
Our read: The Investors.com framing is consistent with a broader bullish thesis that BAC is either in or near a constructive area tied to prior strength. Relative to our snapshot, we acknowledge the intermediate uptrend structure implied by SMA20 > SMA50. However, our near-term signals (RSI 45.38 and MACD below the signal line) argue that momentum this week has softened, and spot sits beneath both key moving averages. We therefore align with the medium-term constructive implication of the Investors.com note but remain more cautious for the coming week, where reclaiming 46.32 (SMA50) is a necessary first step. In other words, we see the 50-handle as viable on a longer horizon if the averages are regained and momentum normalizes, but not as a high-probability target for the immediate next week given the present readings.
2) TipRanks: Strong Buy Based on Technical Indicators
External view: TipRanks states, “Technical indicators suggest that BAC stock is a Strong Buy, implying further upside from current levels.”
Our read: Our snapshot-specific indicators do not currently corroborate a “Strong Buy” in the immediate term. RSI below 50 and a negative MACD under its signal line are characteristic of neutral-to-soft conditions. That said, we can reconcile a bullish take if the assessment is framed over an intermediate horizon: the SMA20 > SMA50 alignment leaves room for the pullback to morph into a buy-the-dip setup upon confirmation (e.g., a close back above the SMA50, firming RSI). So we diverge on the very near-term classification, while acknowledging that the pathway to a constructive, trend-following long thesis remains open if price action improves.
3) Investing.com: Strong Sell Summary
External view: Investing.com summarizes BAC as “Strong Sell. RSI(14) 37.873; MACD -0.11.”
Our read: Our RSI value (45.38) is notably higher than the 37.873 referenced in their summary, and our MACD reading (-0.239) is more negative than their -0.11 example. Different platforms can show discrepancies owing to data windows, source feeds, calculation timing, or settings. Despite the numerical differences, both their summary and our snapshot agree on one important point: momentum is not supportive near-term (MACD below zero; sub-50 RSI in our case). We would not label conditions a “Strong Sell” based on our readings alone, because RSI at 45.38 is not weak enough to imply strong downside follow-through by itself. Our stance is more “neutral-to-cautious” into next week rather than emphatically bearish.
How to Trade the Setup: Tactical Considerations
While we do not make recommendations, we can frame how different participant styles might interpret the current structure:
- Trend followers: Likely to wait for a daily close back above 46.32 (SMA50) to re-engage on the long side, with an eye toward a subsequent test of 46.93 (SMA20). A confirmed close above the SMA20 would better validate trend resumption.
- Mean reversion traders: May consider the 45-handle as a potential area where dip interest could appear, especially if momentum indicators stabilize or improve. Evidence of higher lows on intraday frames would be sought for confirmation.
- Risk managers: Might use 46.00 as a tactical pivot. Sustained trading below this level without improvement in MACD/RSI keeps risk skewed to the downside. A weekly close below 45.00 would imply deeper corrective risk into the mid-44s.
Indicator Interplay: What to Watch Next Week
These are the key technical events that would shift our bias:
- Reclaiming the SMA50 (46.32): First constructive sign. It would suggest sellers are losing grip and open the door to test the SMA20 at 46.93.
- Breaking above the SMA20 (46.93): Confirms momentum normalization. At that point, RSI should be pushing toward or through 50, and the MACD histogram would ideally be rising toward zero.
- RSI trajectory: A move from 45s to above 50 would mark a regime shift from neutral/slightly negative to constructive.
- MACD histogram behavior: A sequence of less negative readings signals downside momentum is fading. A cross of MACD above its signal would add confirmation.
- Failure and lower drift: Rejection under 46.32 followed by a daily close below 45.00 would validate the bearish continuation scenario.
Risk Factors & What Could Invalidate the Setups
Technical setups are probabilistic, not deterministic. Several risk factors could rapidly override the patterns outlined above:
- Event risk: Company-specific headlines, sector-wide news, or macroeconomic releases can trigger gaps and breakouts that render short-horizon technical levels less relevant.
- Correlation shocks: As a large financial, BAC can be sensitive to broad financial sector flows and interest-rate expectations. Sudden changes in sentiment across banks can cause swift moves irrespective of local technicals.
- Liquidity conditions: Thin liquidity or concentrated flows can exaggerate intraday moves around key levels (like the SMA50), yielding false breaks.
- Timeframe mismatch: Indicators derived from a 7-day snapshot are inherently short-term. Intermediate or long-term investors may weigh signals differently, and their actions can overpower near-term levels.
- Indicator drift: Small numerical changes around thresholds (e.g., RSI near 50 or MACD near its signal) can flip signals with only modest price action, especially early in the week.
Invalidation cues for our scenarios:
- Bullish scenario invalidation: Failure to hold 46.00 after a breakout above 46.32; RSI failing to improve; MACD histogram turning more negative.
- Bearish scenario invalidation: A decisive close above 46.32 followed by traction toward 46.93; RSI pushing above 50 and MACD curling upward.
- Base-case range invalidation: A material surprise move that clears 46.93 with momentum—or breaks 45.00 on a closing basis—would invalidate the expectation for contained range-trade.
Putting It All Together
With BAC closing at 46.01, down 2.67% on the week, the immediate read is a methodical pullback. The price is currently below the SMA50 at 46.32 and the SMA20 at 46.93, shaping these averages into overhead resistance. RSI at 45.38 and a negative MACD under its signal corroborate the short-term soft tone. The offsets: SMA20 remains above SMA50, a configuration that often persists in ongoing intermediate uptrends. The modest distance from spot to the SMA50 underscores how quickly the posture could brighten if buyers regain that line.
Our weekly base case is for a 45.20–46.80 range, with 46.32 acting as the inflection point: recover it, and presses into the high 46s become plausible; fail there, and 45.00 could be probed. For more directional conviction, we would look for either a daily close above 46.93 (SMA20) to argue for momentum normalization or a daily close under 45.00 to argue for downside continuation.
Editorial Statement
This analysis is intended for informational and educational purposes only and is based solely on the provided data snapshot and the cited external sources. It is not investment advice, an offer, or a solicitation to buy or sell any security. All technical indicators discussed (price relative to moving averages, RSI, MACD) are inherently probabilistic and can produce false signals. Markets can move quickly for reasons unrelated to the patterns referenced here. You are responsible for your own investment decisions, and you should consider consulting a qualified financial professional who can evaluate your specific financial situation, objectives, and risk tolerance before making trading or investment decisions.
Appendix: Quick Reference to the Core Numbers
- Ticker: BAC
- Last close: 46.01
- Week-over-week change: -2.67%
- SMA20: 46.93
- SMA50: 46.32
- RSI(14): 45.38
- MACD(12/26/9): -0.239; Signal: 0.103
Why Our View Is Balanced Despite Conflicting External Signals
External takes range from “Strong Buy” to “Strong Sell.” Our balanced judgment arises from the snapshot specifics:
- Evidence for caution: Price below the SMA20 and SMA50; RSI below 50; negative MACD under its signal.
- Evidence against outright bearishness: SMA20 still above SMA50; RSI far from oversold; proximity to the SMA50 suggests reclaim is feasible.
Thus, the next decisive tell will be how price behaves around 46.32 (SMA50). A swift reclaim would validate the rebound scenario; continued rejection argues for a deeper test toward 45.00.
Links referenced for comparative outlook:
- Investors.com – Bank Of America, Two Others In Buy Zones After New Highs
- TipRanks – Bank of America Stock’s (BAC) Technical Indicators Signal a “Strong Buy”
- Investing.com – BAC Technical Analysis, RSI and Moving Averages
As always, the synthesis of multiple sources should be filtered through your own process and risk management framework. Our analysis emphasizes what the current, provided indicators imply for the upcoming week and highlights the specific levels and signals that would cause us to update the bias.