Citigroup (C) Weekly Technical Analysis: Short-Term Pullback Within an Intermediate Uptrend
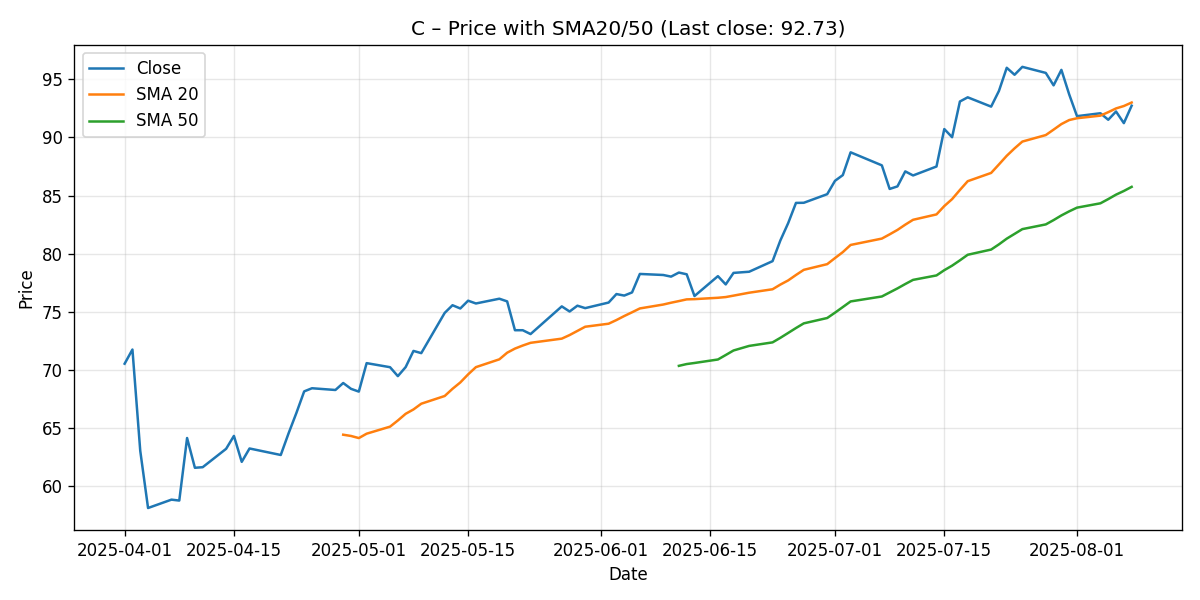
As of the latest 7-day snapshot generated on 2025-08-10, Citigroup (C) closed at 92.73, finishing the week down approximately 1.04%. The technical picture shows price fractionally below the 20-day simple moving average (SMA20 = 93.00) yet comfortably above the 50-day simple moving average (SMA50 = 85.75). Momentum is balanced-to-soft near-term with RSI14 at 57.58 and MACD (12/26/9) at 1.81 below its signal at 2.61, leaving the histogram modestly negative. Taken together, this framework suggests a short-term consolidation inside an intermediate uptrend.
1) Executive Summary
Citigroup’s weekly tape resolved modestly lower, with the stock slipping 1.04% over the past seven days to 92.73. Price sits a hair under the 20-day moving average (93.00, a marginal -0.29% gap) while holding a clear cushion above the 50-day (85.75, about +8.14% above). RSI14 at 57.58 remains in a constructive, non-overbought band, but MACD’s line (1.81) below its signal (2.61) signals that upside momentum has paused in the very near term even as the MACD remains above the zero line, consistent with an underlying intermediate uptrend.
- Trend structure: Slight near-term softness (price fractionally below SMA20) within a still-bullish intermediate trend (price materially above SMA50).
- Momentum: RSI14 at 57.58 is supportive but not stretched; MACD’s negative histogram (~-0.80) flags deceleration rather than outright reversal.
- Weekly change: -1.04% suggests digestion after prior gains, with price clustering near a pivot (SMA20).
- Key observation: SMA20 (93.00) is an immediate battleground; the 50-day (85.75) is the principal intermediate support.
Base case for the coming week: a range-bound consolidation centered around 92–94 while momentum rebuilds. A decisive reclaim and hold above the 20-day (93.00) would open a path toward incremental resistance zones in the mid-90s. Conversely, a clean break and close below the low-92s would raise the odds of testing psychological support closer to 90, with the deeper safety net at the 50-day (~85.75) if selling extends.
Directional bias for next week: neutral to slightly constructive, conditioned on price’s behavior around 93.00 and whether MACD starts curling higher against the signal. Our detailed levels and scenario ranges are outlined below.
2) Weekly Market Context & Trend
The 7-day window indicates a mild pullback (-1.04%) that has brought price to just under the 20-day average. From a trend standpoint, two elements matter most this week:
- Short-term trend (days to a few weeks): Neutral-to-soft. Trading below the 20-day—albeit marginally—usually means buyers are pausing. That aligns with the negative MACD histogram, a sign the latest upswing has cooled.
- Intermediate trend (multi-week to few months): Constructive. Price remains well above the 50-day (by approximately 8.14%). Additionally, the 20-day itself sits meaningfully above the 50-day by roughly 8.46%, reinforcing the idea that the prevailing intermediate bias is still up even as the near-term leg consolidates.
When a stock trades in this configuration—slightly below the 20-day but comfortably above the 50-day—it often indicates a routine pause in an ongoing trend rather than an immediate top. Buyers typically assess whether momentum can reset without losing the broader structure. If the 20-day is reclaimed quickly, the uptrend resumes; if the 20-day continues to cap price and momentum fades, the market may probe lower supports, often toward round psychological levels before stronger moving-average support is tested.
Given the current readings (RSI 57.58; MACD line above zero but below signal), the odds favor consolidation over abrupt trend change. The larger battle for the coming week is whether bulls can reassert control above 93.00 and convert that level from headwind back into a tailwind.
3) Detailed Technicals (Price + SMA20/50, RSI14, MACD 12/26/9)
Price vs. SMA20 and SMA50
Last close: 92.73
• SMA20: 93.00 (price is modestly below by approximately -0.29%)
• SMA50: 85.75 (price is about +8.14% above)
The 20-day remains a near-term pivot. A sustained move back above 93.00 would be a constructive signal that buyers are willing to defend the short-term trend line. If price cannot clear and hold above 93.00, the market often rotates to test demand at progressively lower reference points—commonly round levels (e.g., 92, 91, 90) before the more substantial 50-day average (~85.75) comes into play. The spacing between SMA20 and SMA50 also supports an intermediate bullish bias: the SMA20 at 93.00 exceeds the SMA50 by approximately 7.25 points (~8.46%), a classic alignment for an uptrend that is pausing rather than reversing.
RSI14 (Relative Strength Index)
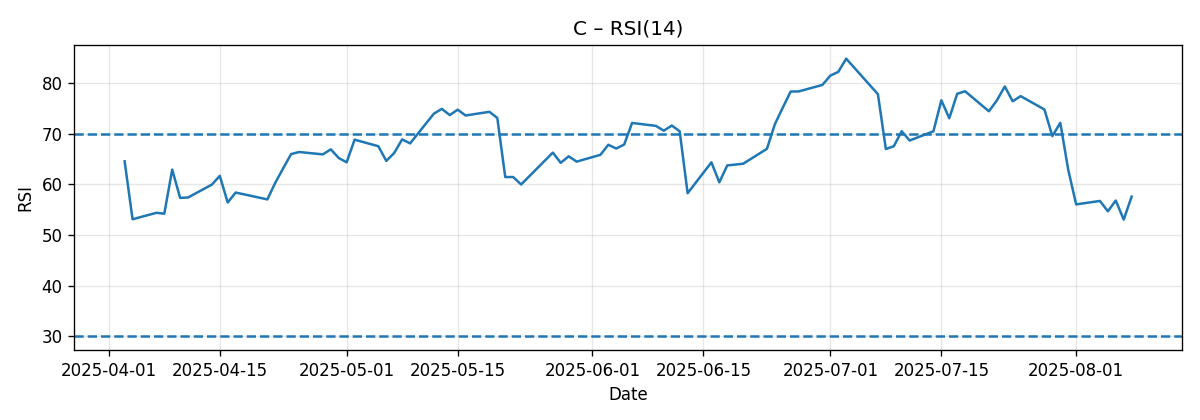
Current RSI14: 57.58
Interpretation: an RSI in the upper 50s is typically associated with healthy, non-exhausted momentum. It is neither overbought nor oversold. The location suggests:
- Constructive but not euphoric: Conditions remain conducive to trend continuation if price can re-engage the 20-day.
- Flexibility: The RSI has room to rise toward the 60s–70s on a renewed upswing. Conversely, a dip under ~50 would caution that buyers are losing initiative in the short run.
For the week ahead, watch whether RSI holds above the mid-50s. A steady or rising RSI while price retakes 93.00 would corroborate a bullish resumption. A slip below 50, on the other hand, would add weight to a deeper pullback scenario.
MACD (12/26/9)
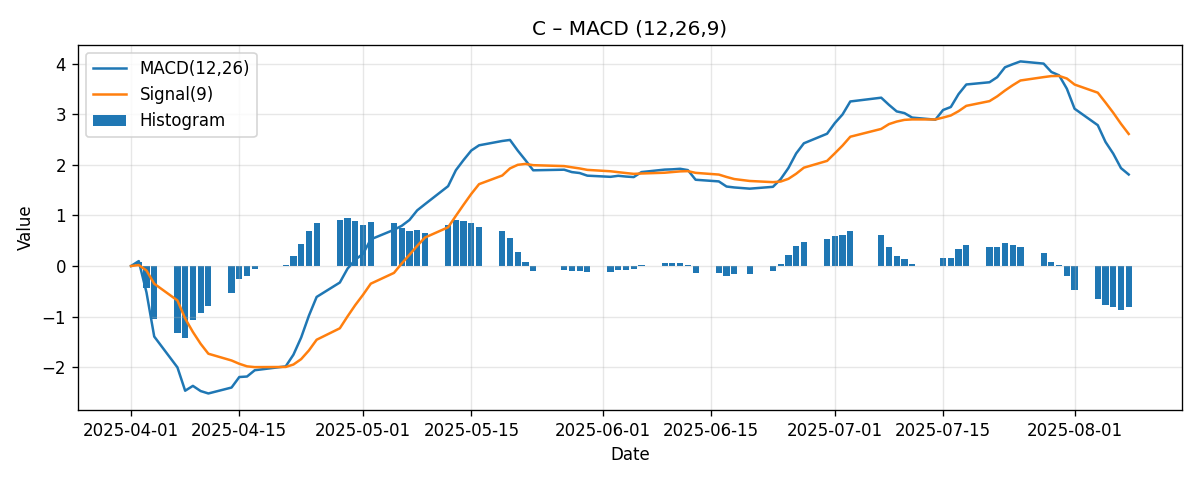
MACD line: 1.81
Signal line: 2.61
Histogram: ~-0.80 (MACD below signal)
MACD remains above zero—consistent with intermediate trend health—but below the signal line, indicating short-term momentum loss. This configuration is very common during consolidations: the trend is not broken, but the push higher needs to reset. Two observations for the week ahead:
- Re-acceleration signal: If price can reclaim 93.00 and the histogram starts to rise (less negative), it would suggest MACD is curling back toward the signal, an early sign of upside momentum returning.
- Cautionary cue: If price fades further and the histogram expands negatively while the MACD line trends down toward the zero line, it would imply a more meaningful loss of momentum and raise the odds of tests toward lower supports.
4) Key Levels (Support/Resistance)
Below is a structured table of important levels. Where levels are derived from provided indicators, we label them as such. Where levels are psychological references, we label them explicitly as heuristic. The latter are common in technical practice but are not measured data points from the snapshot.
| Level (USD) | Type | Rationale | Implication if broken |
|---|---|---|---|
| 93.00 | Near-term pivot / resistance | SMA20 (provided). Price is fractionally below; reclamation would be bullish. | Above: momentum likely rebuilds; Below: consolidation continues or drifts lower. |
| 92.73 | Immediate pivot | Last close (provided). Serves as immediate reference for buyers/sellers. | Below on a closing basis increases the risk of probing lower supports. |
| 90.00 | Psychological support (heuristic) | Round-number area often attracts flows; not a measured data line. | Clean break would shift focus toward the 50-day area. |
| 85.75 | Major support | SMA50 (provided). Primary intermediate trend reference. | Loss of the 50-day would tarnish the intermediate uptrend. |
| 95.00 | Psychological resistance (heuristic) | Round-number area that may cap initial rebound attempts. | Above suggests buyers have regained firm control short-term. |
5) Scenario Analysis (Bullish / Bearish / Most-Likely) With Next-Week Projections
These scenarios translate the current indicator mix into probabilistic pathways. They are not guarantees; rather, they frame how the market often behaves when aligned with this set of readings (price marginally below SMA20, well above SMA50; RSI mid-to-high 50s; MACD above zero but below signal). Numerical ranges are next-week directional guides based on the present balance of trend, momentum, and nearby reference levels.
Bullish Scenario
Trigger and narrative: A decisive push back above the 20-day (93.00) early in the week, ideally followed by intraday dips being bought and daily closes holding above 93.00. This would likely coincide with a MACD histogram that becomes less negative and an RSI that drifts into the low-to-mid 60s.
- Projected next-week range on a bullish resolution: approximately 93.20 to 96.80.
- Intraweek focus: Overcoming initial overhead at the mid-93s and pressing into the mid-90s where psychological resistance (around 95.00) may appear.
- What confirms it: Daily closes above 93.00 with rising volume (if available to assess) and flattening/upturning MACD histogram.
- What likely fails it: Rejection thrusts at or just above 93.00 followed by closes back below 92.70–92.50.
Bearish Scenario
Trigger and narrative: Repeated failures to reclaim 93.00 accompanied by further MACD deterioration (histogram more negative) and RSI rolling down toward the low 50s or below. That combination raises the probability of probing lower psychological support zones.
- Projected next-week range on a bearish rotation: approximately 89.50 to 92.50.
- Intraweek focus: Watching the 92s—if sellers close the market under the prior close (92.73) and keep pressure on, 91–90 can attract bids, with deeper support into the SMA50 region (~85.75) if pressure persists beyond the week.
- What confirms it: A daily close under roughly 92.00 and RSI slipping below 50.
- What likely fails it: Swift buyer response reclaiming 93.00 and stabilizing the MACD histogram.
Most-Likely (Base Case) Scenario
Trigger and narrative: Consolidation around the 20-day pivot with mixed intraday pushes that largely net out near the 92–94 zone by week’s end. MACD stabilizes without a decisive crossover, and RSI remains bracketed in the mid-to-high 50s.
- Projected next-week range for base case: approximately 91.50 to 95.00.
- Base-case weekly close expectation: in the 92.00 to 94.50 area, barring exogenous volatility shocks.
- What confirms it: Sideways price action that respects the 91.5–95.0 corridor and a stabilizing MACD histogram.
- What would upgrade it to bullish: Multiple closes above 93.00 that shift the weekly battleground into the mid-90s.
- What would downgrade it to bearish: Closing breaks below 92.00 followed by continued momentum loss.
Note: The ranges above are scenario guides that reflect typical behavior given the current technical context. They are not predictions of certainty and should be used in conjunction with risk management.
6) Comparative Outlook: External Predictions vs. Our View
We contrast our short-horizon technical view with three external perspectives. These sources emphasize different time frames and methodologies, which helps contextualize our next-week scenarios within broader narratives.
Barron’s (via Wells Fargo analyst Mike Mayo)
Source: Barron’s
Quoted view: “Mayo reiterates Citi as his top pick with a 12-month target of $115 and potential to reach $150 by 2027.”
Interpretation: This is a fundamentally anchored, multi-quarter to multi-year view. It does not address next-week dynamics but conveys a strong constructive stance on the medium- to long-term outlook.
Alignment with our analysis: Directionally aligned with our intermediate uptrend read (price well above SMA50; SMA20 above SMA50). However, our focus is weekly; near-term, MACD’s negative histogram suggests momentum digestion. There is no conflict—timeframes differ. Our base-case consolidation and need to reclaim 93.00 simply reflects the day-to-week mechanics that often occur even inside larger bullish narratives.
Reuters (Wells Fargo ‘dominant pick’ outlook)
Source: Reuters
Quoted view: “Wells Fargo predicts Citi’s stock could double in three years and raises its price target to $110, maintaining an overweight rating.”
Interpretation: Another long-dated, fundamentally driven thesis. It underscores constructive expectations over years rather than days or weeks.
Alignment with our analysis: Compatible. The intermediate uptrend readings (20-day above 50-day, price above 50-day) do not contradict a multi-year bullish thesis. Our caution near 93.00 this week is about execution timing: even stocks on a long-term path higher typically experience consolidations, technical resets, and tests of moving averages along the way.
Investor’s Business Daily (IBD) relative strength note
Source: Investors Business Daily
Quoted view: “In consolidation with a target buy point at $84.74; look for a breakout on volume at least 40% above average.”
Interpretation: This technical perspective emphasizes classic base patterns and volume-driven confirmation. The specified buy point (84.74) is notably below the current close (92.73), implying that either the consolidation has resolved earlier or that price is trading above the cited entry area.
Alignment with our analysis: Our snapshot-based read aligns with the notion of consolidation, though the current price is above IBD’s referenced buy point. The fact that the 50-day average sits around 85.75 (close to that buy-point zone) reinforces the idea that the mid-80s area functions as major intermediate support. Our weekly caution around 93.00 complements IBD’s approach: even above a base, prudent technicians often seek renewed momentum signals (e.g., reclaiming SMA20, improving MACD) before assuming continuation higher.
Bottom line: All three external views are consistent with a broader constructive stance on Citigroup, albeit over longer horizons or with specific base-pattern criteria. Our analysis is narrower in scope—focused on the next week—and accordingly emphasizes short-term pivots (93.00) and momentum resets that can occur within larger uptrends.
7) Risk Factors & What Could Invalidate The Setups
Technical setups are contingent on the evolution of price and momentum. Several factors could invalidate or materially alter the scenarios outlined above:
Technical Invalidation Triggers
- Failure to reclaim SMA20 (93.00): Persistent rejection at or just below 93.00, especially on multiple closes, keeps the short-term tone soft, increasing the risk of tests toward lower psychological supports.
- RSI deterioration: A drop of RSI14 from 57.58 to below 50 would indicate a momentum regime shift unfavorable to bulls in the near term.
- MACD weakness: Expanding negative histogram coupled with the MACD line trending toward or below the zero line would escalate the probability of a deeper pullback.
- Loss of SMA50 (85.75): A decisive close below the 50-day would dent the intermediate uptrend and would invalidate the constructive medium-term bias until reclaimed.
Market Structure and Liquidity Risks
- Gap risk: Overnight gaps on headlines can bypass planned levels, creating slippage against stop-losses or entries.
- Volatility spikes: Sudden volatility expansions can widen ranges beyond scenario bounds, especially around events or sector-wide flows.
- Psychological levels: Round numbers like 90 can concentrate orders; breaks can trigger outsized moves as stops cluster.
Event and Information Flow Risks
While this report uses only the provided dataset and the three cited external perspectives, market-moving information can surface unexpectedly (e.g., sector developments, regulatory updates, or company-specific headlines). Such developments can supersede technical signals, especially over short horizons. Traders should be prepared for scenario shifts when new information changes the risk-reward calculus.
Timeframe Mismatch
The external targets (e.g., 12-month to multi-year price objectives) reflect longer-term theses. Short-term consolidations, head fakes at moving averages, and momentum resets are normal on the path toward any longer-term outcome. A temporary weekly pullback does not inherently negate a favorable multi-quarter view, nor does a weekly breakout assure long-term objectives will be met without further consolidation.
8) Editorial Statement (Disclaimer)
This analysis is presented for informational and educational purposes only and reflects a short-horizon, technical perspective based on the snapshot provided (price, SMA20/50, RSI14, MACD 12/26/9) and three external viewpoints. It is not investment advice, nor is it a recommendation to buy, sell, or hold any security. Markets are uncertain and subject to rapid change. Always perform your own due diligence and consider your financial situation, objectives, risk tolerance, and investment horizon. If you are unsure about any investment decision, consult a qualified financial advisor. Past performance and historical indicator behavior are not guarantees of future results. Any forward-looking scenario ranges herein are illustrative and inherently uncertain.
Actionable Checklist for the Week Ahead (Optional Aid)
- Price vs SMA20 (93.00): Monitor intraday attempts to reclaim and hold above. Sustained closes above this mark would tilt the weekly bias constructive.
- RSI14 behavior: Holding 55–60 is supportive; slips under 50 would caution that the near-term pendulum has swung to sellers.
- MACD histogram: Watch for stabilization (less negative) as a precursor to renewed upside momentum.
- Support humility: If price loses 92s decisively, be prepared for a psychological test of 90; if that fails, the 50-day (~85.75) is the key intermediate line in the sand.
In sum, Citigroup’s chart presents a classic “pause within trend.” The immediate test is tactical: can price re-establish itself above the 20-day and nudge momentum higher? If yes, the mid-90s become viable next-week territory. If not, a controlled drift toward 90 is plausible, with the 50-day as the deeper, more durable support zone.