Bitcoin (BTC-USD) Weekly Technical Analysis: Momentum Builds Above $120K
Executive Summary
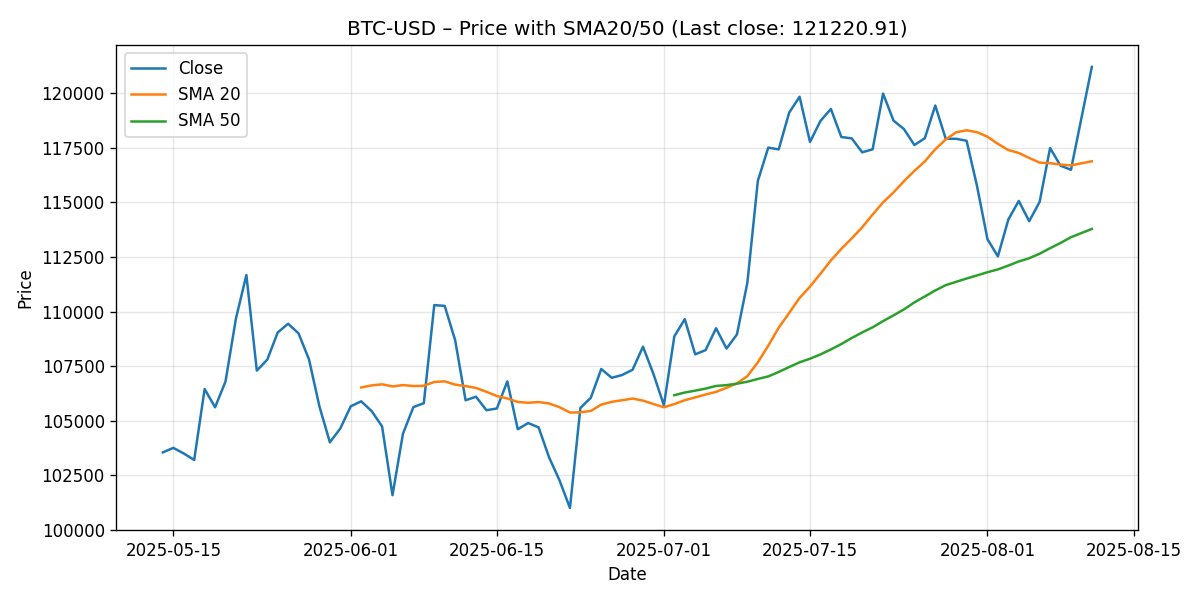
Bitcoin (BTC-USD) closed the latest weekly window at 121,220.91, advancing 5.34% over the past seven days based on the provided snapshot timestamped 2025-08-11. Technically, the setup leans constructive: price sits above both the 20-day and 50-day simple moving averages (SMAs), the 20-day is above the 50-day, the 14-day Relative Strength Index (RSI) is in bullish territory without being overbought, and the MACD remains positive with a widening histogram.
- Last close: 121,220.91
- Weekly change: +5.34%
- SMA20: 116,889.95; SMA50: 113,786.84
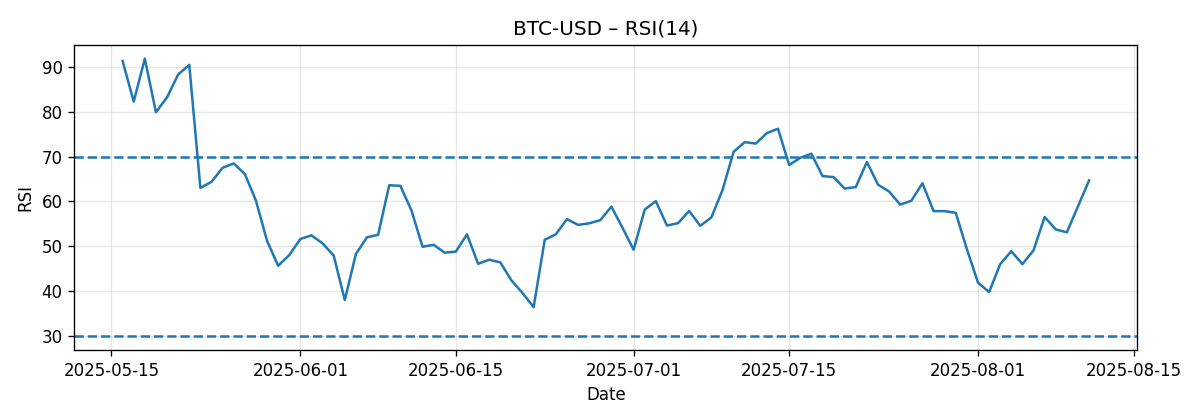
- RSI(14): 64.68 (bullish, not overbought)
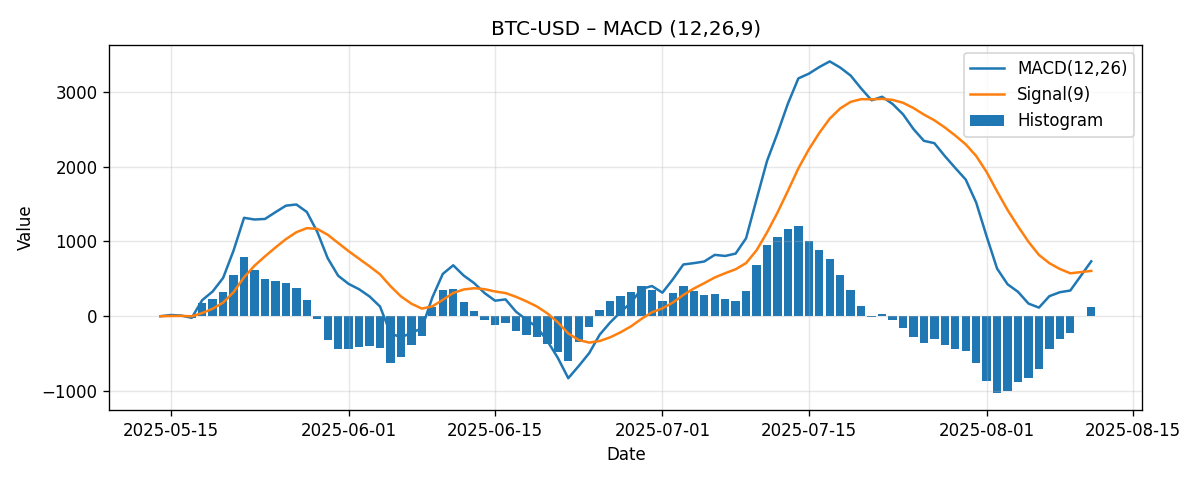
- MACD(12/26/9): 733.72 vs. signal 605.72 (positive histogram ≈ 128)
What this means near term: the balance of evidence favors dip-buying interest above the 20-day SMA while recognizing that a swift move into RSI > 70 could invite a cooling phase. Key supports cluster near 120,000, 116,890 (SMA20), and 113,787 (SMA50), while overhead focal points gather at 122,500, 125,000, and 130,000 as psychological waypoints.
Weekly Market Context & Trend
Within the last seven days, Bitcoin’s price advanced by 5.34%, lifting it decisively above both its 20-day and 50-day moving averages. In classical trend analysis, a structure where price > 20-day SMA > 50-day SMA is considered a bullish alignment that often accompanies short-term uptrends. The current arrangement meets that criterion. Moreover, the RSI at 64.68 corroborates momentum strength without yet signaling conditions typical of climactic overbought readings (commonly > 70). The MACD not only sits above its signal line but also above the zero line, a configuration that typically appears early to mid-phase in upside swings.
From a tactical perspective, a 5%+ weekly gain suggests trend participants had the upper hand, while mean-reversion traders may now look for opportunities closer to the 20-day SMA to manage risk more tightly. The 20-day sits around 116,890—approximately 3.7% below the last close—providing a proximate reference for shallow pullbacks. The 50-day near 113,787—about 6.5% below spot—represents a more medium-term trend boundary that often draws bids if the first support layer fails.
It is important to emphasize that this analysis focuses strictly on the supplied technical snapshot. While broader macro events and market structure can influence Bitcoin dramatically, the weekly trend context derived from the given metrics points to persistence in the existing upward impulse, tempered by the usual risk of consolidation as momentum gauges advance toward higher thresholds.
Detailed Technicals (Price, SMAs, RSI, MACD)
Price Action vs. 20-day and 50-day SMAs
Price closed at 121,220.91, above both the 20-day SMA (116,889.95) and the 50-day SMA (113,786.84). The 20-day sits above the 50-day, which, together with price holding above both, yields a bullishly stacked configuration. The degree of extension from these averages gives additional context:
- Distance from SMA20: ~3.70% above
- Distance from SMA50: ~6.53% above
Such an extension is meaningful but not extreme. In practical terms, short-term pullbacks toward the 20-day are common in sustained uptrends and can help reset intraday overextensions without breaking the broader structure. A daily close back below the 20-day would not, by itself, invalidate the trend but would raise the odds of a deeper test toward the 50-day. Conversely, holding above the 20-day while making higher lows would keep the momentum construct intact and set the stage for attempts at round-number resistances ahead.
RSI(14): Momentum Strength Without Overbought Excess
The RSI(14) reading is 64.68. That places momentum in a bullish zone (usually 55–65+ is consistent with an uptrend) while still below the red line that often signals overstretched conditions (70). The “distance to overbought” is roughly 5.32 RSI points. Practically, this room can accommodate continued upside probes without immediately triggering classical overbought alerts.
That said, should RSI drive quickly into the mid-70s, short-term traders often expect consolidation or a shakeout. Conversely, a drop back below ~55 would warn that momentum is flagging and that the 20-day SMA could come into play as a reversion target. Absent a notable momentum breakdown, the current RSI favors the path of least resistance being mildly higher or sideways-up.
MACD(12/26/9): Positive and Widening
The MACD is 733.72 versus a signal line at 605.72, leaving a positive histogram around 128. This indicates that the faster-moving average of momentum is outpacing the slower one, consistent with trend continuation probabilities. The fact that MACD values are above zero further supports the idea that this is not merely a counter-trend rally but, by technical definition, an advance with positive momentum foundation.
A natural progression in such conditions could include brief histogram contractions (smaller positive bars) during pauses, without necessarily implying a trend reversal. True caution would be warranted if the histogram flips negative (MACD crossing below signal), especially if that coincides with price slipping under the 20-day SMA. For now, the MACD picture leans bullish.
Key Levels (Support/Resistance)
The following levels are derived from the provided snapshot (SMA values and last price) combined with well-observed round-number psychology commonly seen in BTC price behavior. They are intended as indicative technical reference points rather than absolute predictions.
| Level | Type | Rationale | What to Watch |
|---|---|---|---|
| 130,000 | Resistance (psychological) | Major round number; potential profit-taking zone if momentum persists. | Reaction to first approach; rejection could trigger mean reversion to 125k–122.5k. |
| 125,000 | Resistance (near-term psychological) | Prominent round number overhead of current price; often a tactical objective. | Strong close above may extend the range toward 128k–130k. |
| 122,500 | Resistance / Pivot | Nearby overhead waypoint; useful for gauging immediate follow-through strength. | Holding above on closing basis would favor incremental gains; repeated failures hint consolidation. |
| 120,000 | Support / Pivot | Round-number magnet close to last price; often tested in consolidations. | Clean support bounce preserves short-term momentum structure; loss opens risk to SMA20. |
| 116,890 | Support (SMA20) | Dynamic trend support; about 3.7% below last close. | Daily close below raises odds of deeper tests; successful retests keep trend intact. |
| 115,000 | Support (psychological) | Intermediate round number beneath the 20-day; may attract dip buyers. | Failure here would shift focus toward the 50-day SMA. |
| 113,787 | Support (SMA50) | Medium-term trend boundary; approx. 6.5% below last close. | Loss of the 50-day would question the prevailing uptrend’s durability. |
| 110,000 | Support (psychological) | Another round number of interest if volatility expands to the downside. | Watch behavior if tested quickly; sharp breaks may accelerate selling. |
| 100,000 | Major Support (psychological) | Key threshold widely watched by market participants. | Would likely be a battleground in larger drawdowns, per many long-horizon outlooks. |
Scenario Analysis (Next-Week Projections)
These scenarios translate the current technical posture into next-week probability-weighted paths. The numerical ranges are intended as plausible trading bands based on the momentum profile and proximity of the noted levels; they are not guarantees.
Bullish Scenario
- Trigger/confirmation: Sustained intraday holds and preferably a daily close above ~122,500.
- Narrative: Buyers maintain control, with shallow intraday dips finding support near 120,000–121,000. Momentum remains constructive as RSI grinds in the mid-60s to upper-60s without popping into persistent overbought readings. MACD histogram remains positive.
- Projection (next week): 123,800 to 128,500, with upside spikes probing as high as the 129,500–130,000 area if momentum persists.
- Invalidation: A failed breakout that immediately loses 120,000 on a closing basis would undermine the bullish path and hand the initiative back to mean-reversion sellers.
Most-Likely Scenario (Sideways-Up Consolidation)
- Trigger/confirmation: Price respects 120,000 as a pivot, oscillating between nearby resistance at 122,500 and occasional checks of 120,000–121,000.
- Narrative: After a 5%+ weekly gain, BTC enters digestion mode. RSI hovers in the high 50s to mid-60s as the market awaits a fresh catalyst. MACD histogram may contract but stays positive.
- Projection (next week): 119,000 to 124,500, with intraday whipsaws around round numbers and a tactical bias to buy dips above the 20-day SMA.
- Invalidation: A decisive daily close below the 20-day SMA (~116,890) would shift the balance toward the bearish scenario.
Bearish Scenario
- Trigger/confirmation: A clean break and daily close below 120,000, followed by failure to reclaim it, pulling price into the 116,890 (SMA20) region.
- Narrative: Momentum cools; RSI slips toward the low 50s; MACD histogram compresses toward zero. A second wave of selling develops on a failed bounce near 120,000, exposing the SMA50.
- Projection (next week): 118,800 to 115,800, with extension risk toward 113,800 (SMA50 vicinity) on elevated volatility.
- Invalidation: Rapid reclaim of 120,000 followed by a close back above 122,500 would negate the near-term bearish control.
Comparative Outlook: How External Predictions Stack Up
We compare our near-term, technically grounded view with three widely circulated outlooks. Our focus is the next week, while these external pieces address broader horizons; therefore, differences in timeframe naturally shape our alignment or divergence.
1) MarketWatch: Year-End Targets and Policy Caveats
Source: MarketWatch
Strategists see targets between $100,000 and $121,000; watch $73,000 support and policy follow-through after Trump’s win.
Relevance to the snapshot: BTC is already near the upper end of that stated range at ~121,221. From a pure technical stance, our week-ahead analysis does not extrapolate policy outcomes; it focuses on observed momentum and trend posture. Where we align: both perspectives acknowledge that the 100,000–121,000 zone has been a focal band for market psychology, with policy execution a potential swing factor. Where we differ: our next-week lens is narrower. Rather than calling for year-end outcomes, we identify immediate triggers (holding 120,000, overcoming 122,500) that determine whether BTC can press toward 125,000 and 130,000 in the short run. We also emphasize tactical invalidation points (e.g., loss of 120,000 or the 20-day SMA).
2) Barron’s: Wide Cones of Uncertainty
Source: Barron’s
Experts warn bitcoin could surge to $200,000—or slump back to $70,000—as volatility stays elevated.
Relevance to the snapshot: this frames the macro-tail possibilities. Our technical read does not discount such volatility; indeed, BTC’s history makes wide distribution tails plausible. However, our scenarios are explicitly bounded to the next week and thus present far narrower ranges that reflect current momentum and nearby supports/resistances. Alignment: we concur that volatility risk is structurally present and can expand quickly. Difference: we provide tactical levels and weekly ranges grounded in the visible technical posture, whereas the Barron’s framing highlights longer-horizon possibilities—useful for risk budgeting but not for a week-ahead tactical plan.
3) FOREX.com: Momentum Regime and 2025 Upside
Source: FOREX.com
Technical outlook favors buying shallow dips; projection calls for bitcoin to reach $150,000+ in 2025 if momentum persists.
Relevance to the snapshot: the current configuration—price above SMA20/50, RSI near 65, positive MACD—fits well with a “buy shallow dips” regime. Alignment: our baseline calls for shallow retracements to find support above the 20-day SMA, consistent with their momentum thesis. Difference: their call targets 2025 and a 150,000+ objective contingent on momentum persistence. We restrict ourselves to the coming week and present conditional, level-by-level triggers that must hold for the near-term uptrend to remain in force.
Risk Factors & What Could Invalidate The Setups
The following are risk contingencies that could alter the technical picture quickly. These are general market-structure observations and do not rely on any specific external events:
- Momentum reversal signals: An RSI slide below ~55 combined with a MACD histogram flip toward zero/negative would indicate fading momentum, elevating the probability of tests of the 20-day and possibly the 50-day SMA.
- Loss of key moving averages: A decisive daily close below the 20-day SMA (~116,890) followed by a failed retest often precedes a test of the 50-day (~113,787). Breaching the 50-day would weaken the intermediate trend posture.
- Round-number whipsaws: BTC frequently overshoots psychological levels (e.g., 120,000, 125,000). False breakouts or breakdowns around these lines can trigger cascading stops and short-term volatility spikes.
- Volatility clustering: Crypto markets can shift from calm to turbulent quickly. Even without new fundamental catalysts, liquidity pockets can amplify moves, stretching price beyond expected weekly ranges.
- Weekend/overnight liquidity: Off-peak hours can produce thinner order books, leading to exaggerated wicks through nearby support/resistance and complicating risk management.
- Headline sensitivity: While not considered in our snapshot-based technicals, crypto remains sensitive to regulatory headlines, large institutional flows, and market microstructure changes. Such shocks can override short-term technical cues.
From a risk management standpoint, the clearest technical invalidation of the short-term bullish bent would be losing 120,000 and then the 20-day SMA without a quick recovery, particularly if momentum gauges simultaneously roll over. The intermediate trend would come under more serious review if the 50-day SMA fails on expanding downside breadth.
Additional Observations and Tactics
While our core sections outline the main picture, a few tactical notes can help contextualize the coming sessions:
- Pullback depth expectations: Given the 5.34% weekly gain and an RSI shy of overbought, shallow 1–3% dips are a reasonable baseline in an intact uptrend. Deeper-than-expected retracements that reach the SMA20 and stall could still be constructive if followed by higher lows.
- Breakout quality: Should BTC challenge 122,500–125,000, watch for breadth indicators and candle closes. Strong closes near the high of the day/week often precede continuation; conversely, long upper wicks into resistance can precede pullbacks.
- Timeframe alignment: Multiple timeframe alignment (intraday, daily, weekly) typically strengthens signals. With only the provided daily-oriented snapshot, the safest assumption is to defer to the most immediate signals: price relative to SMA20/50, RSI’s zone, and the MACD histogram’s sign.
Putting It All Together
The technical mosaic, built strictly from the provided data, leans bullish into next week with controlled expectations. Price is advancing atop rising short- and medium-term references (SMA20 and SMA50), momentum is positive without being overheated, and nearby round numbers offer clear landmarks for traders to calibrate risk. In this environment, the path of least resistance appears sideways-to-up as long as 120,000 holds on dip attempts and 116,890 (SMA20) undergirds the structure.
Upside attempts should naturally gravitate toward 122,500 and 125,000, where market participants commonly reassess risk and reward. If bulls can secure acceptance above those areas, probing 128,000–130,000 becomes feasible within our bullish scenario range. Conversely, the clearest warning signs would be a failure to hold 120,000, a daily close under the 20-day SMA, and momentum gauges curling lower in tandem.
Editorial Statement (Disclaimer)
This article is a technical analysis based solely on the supplied metrics and cited public sources. It is for informational and educational purposes only and is not investment advice, an offer, or a solicitation to buy or sell any asset. Trading and investing in digital assets involve substantial risk, including the risk of loss. Always conduct your own research and consider consulting a qualified financial professional before making any investment decisions. The scenarios and levels discussed are conditional and may change quickly as market conditions evolve. Past performance is not indicative of future results.
Appendix: Data Snapshot Used
- Ticker: BTC-USD
- Snapshot generated at: 2025-08-11T08:07:36.242012Z
- Last close: 121,220.90625
- Week change: 5.343636766176241%
- RSI(14): 64.6765120542324
- MACD(12/26/9): 733.7173021993367
- MACD Signal: 605.720728629718
- SMA20: 116,889.951171875
- SMA50: 113,786.84046875
- Window days: 7
External sources referenced:
- MarketWatch: Bitcoin bulls eye $100,000 by year-end after Trump win. But watch for this catch.
- Barron’s: Why Bitcoin Could Surge to $200,000, or Fall Back to $70,000
- FOREX.com: 2025 Bitcoin Technical Outlook Preview
Note: Key levels are illustrative and derived from the provided averages, last price, and commonly observed round-number dynamics; they do not incorporate broader order book data or intraday highs/lows beyond the provided snapshot.