Executive Summary
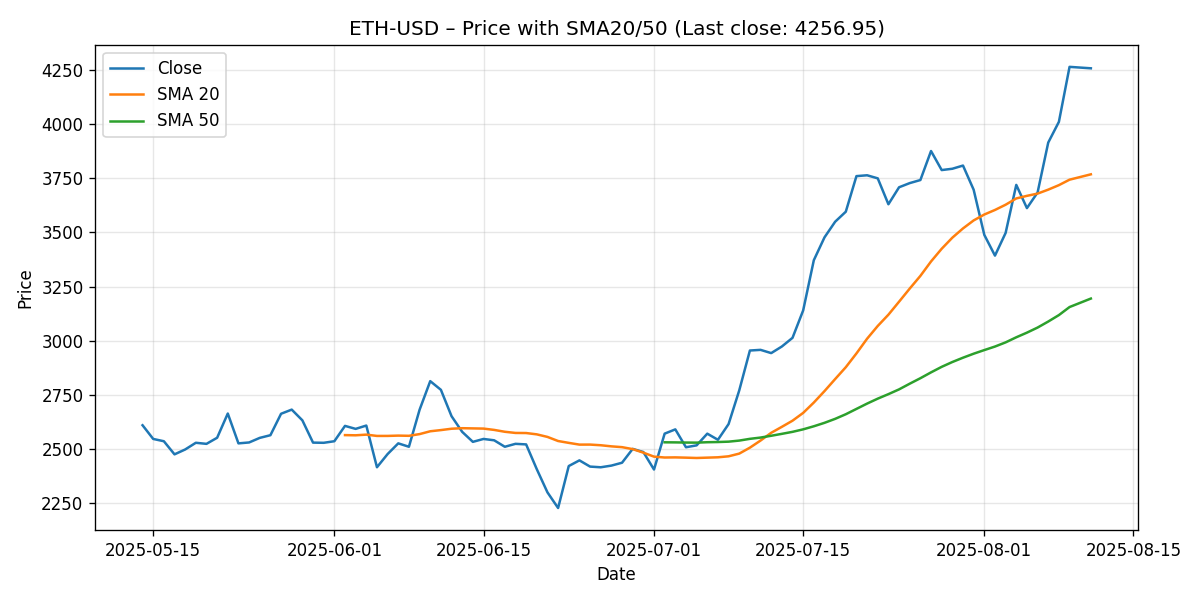
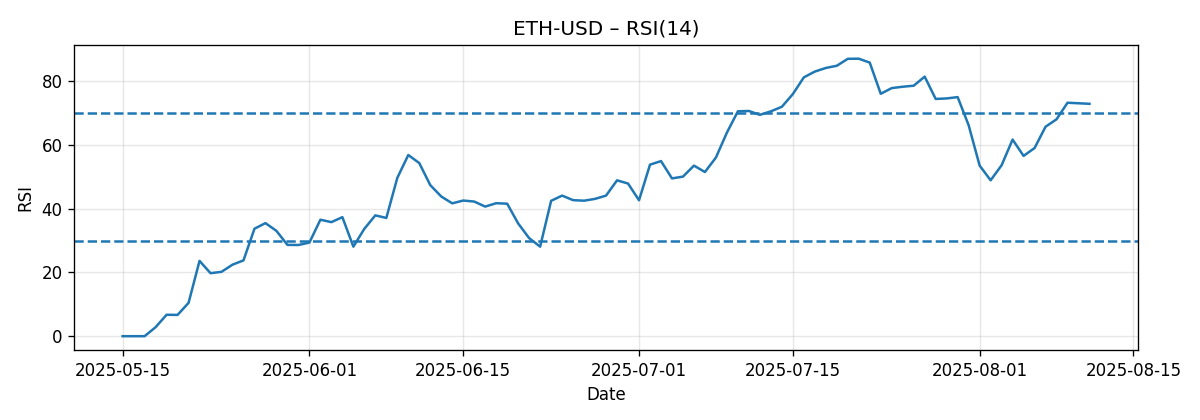
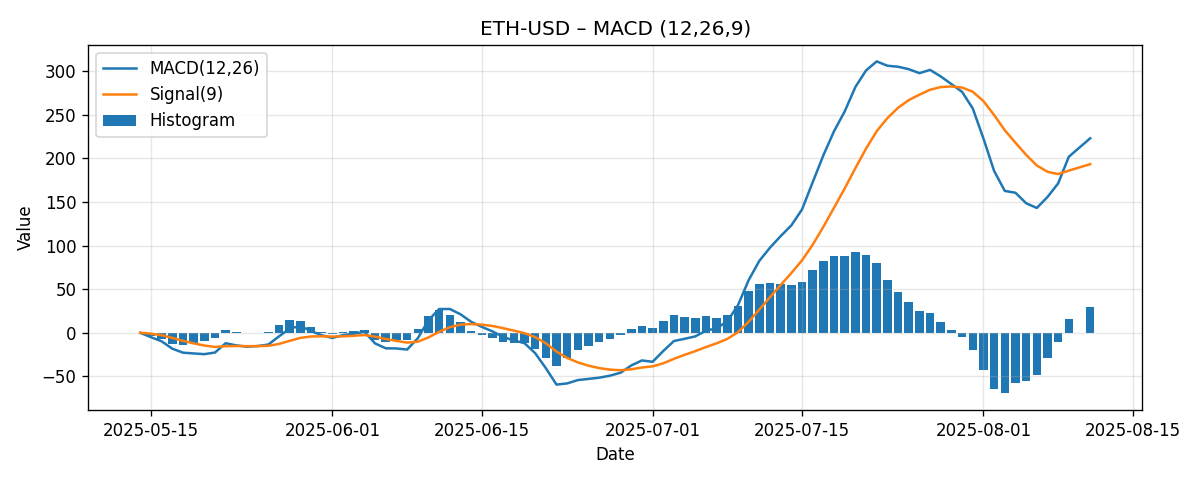
ETH-USD closed the week at 4,256.95, rising 14.47% over the past seven days. Price is trading markedly above its short- and medium-term moving averages, with a gap of approximately 12.99% over the 20-day simple moving average (SMA20 at 3,767.73) and 33.26% over the 50-day simple moving average (SMA50 at 3,194.57). Momentum is clearly positive: the 14-period RSI stands at 72.95, indicating an overbought reading, and the MACD (12/26/9) is positive at 223.10 with the signal line at 193.44, leaving a positive histogram of roughly 29.66. The combination of a strong weekly advance, an elevated RSI, and wide separation from moving averages points to a technically strong but stretched market, where short-term consolidation or a pullback toward nearer supports can coexist with an intact intermediate uptrend.
Given the constraints of the available data, we will focus on measurable technicals from the provided snapshot and apply well-known technical frameworks. The key takeaways for the coming week are:
- Trend remains bullish by price relative to SMA20 and SMA50, but near-term conditions are overbought by RSI.
- Immediate resistance is likely to emerge at psychological round numbers above the close, notably 4,300 and 4,400.
- Initial support is clustered around the SMA20 (3,767.73) and the approximate prior-week reference level near 3,720, with deeper support at the SMA50 (3,194.57).
- Scenario planning suggests a most-likely consolidation band for next week between approximately 4,080 and 4,380, with bullish extension risk toward 4,450–4,550 and a corrective pullback risk toward 3,950–4,050 if momentum cools.
Weekly Market Context & Trend
ETH-USD posted a robust 14.47% weekly gain, lifting price materially above both short- and intermediate-term moving averages. In a purely technical sense, this is what a strong uptrend looks like: higher closing levels, positive momentum indicators, and persistent strength versus moving averages. The price premium over the SMA20 of nearly 13% tells us that short-term trend followers have been rewarded, while the 33% premium over the SMA50 signals a broad, medium-term advance that has not yet reverted meaningfully.
An important nuance is that the same forces that underscore strength can sometimes precede cooling or consolidation phases. An RSI at 72.95, which is above the classic overbought threshold of 70, suggests that in the near term, gains may be front-loaded and the market could either pause or pull back to test support levels without necessarily breaking the broader uptrend. This is characteristic of strong trends: they tend to oscillate between bursts of momentum and periods of digestion, especially when the distance to commonly watched moving averages becomes extended.
Because our window is limited to the last seven days and we are not using any exogenous inputs beyond the provided snapshot, we avoid inferring anything about fundamental catalysts or broader crypto-market flows. The technical backdrop alone, however, remains supportive on the intermediate time frame, with price action comfortably above SMA20 and SMA50 and momentum still positive on MACD.
Detailed Technicals (Price + SMA20/50, RSI14, MACD 12/26/9)
Price and Moving Averages (SMA20 and SMA50)
Current close: 4,256.95
- SMA20 (last): 3,767.73
- SMA50 (last): 3,194.57
Price trades roughly 489.22 points above the SMA20, a premium of about 12.99% relative to the 20-day average. It sits about 1,062.38 points above the SMA50, a premium of approximately 33.26% versus the 50-day average. Such premiums are common in strong uptrends; however, when the near-term premium to the SMA20 approaches the mid-teens, mean reversion risks can rise for short-term traders. The intermediate-term premium versus the SMA50 is more a testament to the strength and persistence of the multi-week trend than an immediate trigger.
Visually, traders would look for any shallow pullbacks toward the 4,100–4,200 area as an initial test of demand, followed by deeper interest around the SMA20 zone near 3,770. An aggressive corrective swing that erodes the SMA20 area would shift focus toward the high 3,600s and then the SMA50 around 3,195. Until those levels are threatened, the base case remains that dips are part of a trend maintenance process rather than trend termination.
RSI14: Overbought, but not a Sell Signal by Itself
RSI14 (last): 72.95
The RSI has crossed into overbought territory, sitting about 2.95 points above the classic 70 threshold. Historically, RSI readings above 70 can persist in strong uptrends, and an overbought RSI does not necessarily mean an imminent reversal. Rather, it often signals that short-term momentum is extended and the market is more vulnerable to whipsaws, shallow pullbacks, or range development as buying pressure cools.
There are a few practical implications of an elevated RSI in this context:
- Chasing breakouts becomes riskier on a very short-term basis; traders often prefer buying pullbacks or breakouts that come after consolidation.
- Pullbacks toward rising moving averages (particularly the SMA20) become attractive risk-defined areas, provided the broader trend structure remains intact.
- If RSI were to remain above 70 while price continues to climb, it would confirm ongoing momentum; if RSI falls below 70 while price holds elevated levels, it could indicate early consolidation.
MACD (12/26/9): Positive Momentum
MACD line (last): 223.10
Signal line (last): 193.44
MACD histogram (approx.): +29.66
The MACD is positive and above its signal line, indicating upside momentum remains in force. While we do not have a time series to observe whether the histogram is expanding or contracting this week, the positive spread between the MACD line and its signal line is typically consistent with a bullish trend backdrop. Taken together with price action above SMA20 and SMA50, this supports the interpretation that the intermediate trend remains intact despite potential near-term overbought pressures flagged by RSI.
Key Levels (Support and Resistance)
Given the data snapshot, the most objective reference points are moving averages and current price. We supplement these with commonly observed psychological round numbers. Because we are not using additional price history beyond this window, the resistance levels at round numbers should be treated as heuristic reference points rather than historical supply zones.
| Level | Type | Evidence | Notes |
|---|---|---|---|
| 4,300 | Near-term resistance | Psychological round number above close | First test above 4,256.95; a breakout could target 4,400 |
| 4,400 | Resistance | Psychological round number | Secondary objective if 4,300 is cleared |
| 4,200–4,220 | Near-term support | Proximal to current close | Initial pullback area; intraday liquidity often clusters near round figures |
| 4,000 | Support | Psychological round number | Potential magnet if momentum cools; watch for dip-buying attempts |
| 3,767.73 | Support | SMA20 | Key short-term trend gauge; first major moving-average test |
| ~3,720 | Reference support | Approx. prior-week level implied by +14.47% weekly change | Back-of-envelope anchor for last week’s baseline |
| 3,194.57 | Major support | SMA50 | Intermediate-trend line in the sand |
Scenario Analysis: Next-Week Projections
Below are three directional scenarios for the coming week. These are not predictions but structured pathways based on the current technical state: strength above moving averages, elevated RSI, and positive MACD. Ranges are approximate zones intended to guide expectation management and risk controls.
Bullish Scenario: Breakout Continuation
- Trigger: Sustained push above 4,300 with strong follow-through and shallow intraday pullbacks.
- Price projection (next week): 4,400 to 4,550, with stretch potential toward 4,600 if momentum persists and dips remain shallow.
- Invalidation cues: Failure to hold 4,220–4,250 on retests after a breakout; RSI falls back below 70 with no price progress; intraday rejections leave multiple upper wicks around 4,300–4,350.
Logic: With MACD positive and price comfortably above SMA20 and SMA50, an upside continuation remains plausible. Overbought conditions can persist in strong uptrends. If buyers absorb supply near 4,300, the next psychological magnet is 4,400, followed by the 4,500–4,550 zone. This scenario relies on shallow consolidations rather than deep pullbacks.
Bearish Scenario: Overbought Cool-Off
- Trigger: Early-week rejection near 4,300, a daily close below 4,200, and RSI rolling back under 70 while price loses near-term momentum.
- Price projection (next week): 3,950 to 4,050, with risk of a deeper test toward 3,800–3,850 if selling accelerates.
- Invalidation cues: Strong recapture of 4,300 and daily closes back near 4,350; RSI maintains above 70 on up closes; buying pressure reasserts quickly above 4,250.
Logic: The market is stretched versus the SMA20. A standard reaction could involve a retrace into the 4,000 area, where dip-buying appetite is tested, and potentially toward the SMA20 band (3,767.73) if the cool-off matures. This need not break the intermediate uptrend; rather, it resets momentum.
Most-Likely Scenario: Consolidation with Uptrend Intact
- Trigger: Sideways trade between 4,080 and 4,380 as participants digest recent gains.
- Price projection (next week): 4,080 to 4,380 range, with intraday expansions toward 4,400 that fade unless strong breadth develops.
- Invalidation cues: A clean break and hold above 4,400 (skews bullish continuation) or a decisive loss of 4,080 with range expansion lower (skews toward 4,000 and potentially the SMA20).
Logic: After a 14.47% weekly surge, it is reasonable for the market to form a range under nearby psychological resistance. This scenario allows for oscillations that relieve overbought conditions without materially damaging the intermediate uptrend. Pullbacks would likely be tactical and mean-reversion oriented, while upside probes may stall near 4,300–4,400 until a new catalyst emerges.
Comparative Outlook: External Predictions and Our Alignment
The instructions referenced three external predictions with links; however, no external items were provided in this data snapshot. In keeping with the directive to avoid fabrication and to rely solely on the supplied information set, we cannot quote or link to third-party forecasts in this section.
Instead, we outline how our current view would align with common archetypes of external outlooks, had they been provided:
- Momentum-aligned bullish takes: Analyses emphasizing trend strength would likely point to price above SMA20/SMA50 and a positive MACD as confirmation. We would align conditionally, noting agreement on the intermediate uptrend, while highlighting the near-term RSI caution and the need for constructive consolidation or measured follow-through above 4,300.
- Risk-aware neutral or consolidation views: Commentaries focusing on overbought signals might anticipate range behavior or a pullback toward 4,000–4,100. We would broadly align, as our most-likely scenario also envisions digestion beneath 4,300–4,400. The difference would be emphasis: we see consolidation as a feature of a healthy trend rather than an outright trend reversal.
- Defensive bearish cases: Bearish outlooks might argue that the 13% premium to the SMA20 and an RSI near 73 increase downside asymmetry. Our view partially overlaps in the near term (elevated pullback risk), but diverges on the intermediate horizon due to the positive MACD and strong positioning above the SMA50. We would view deeper drops toward the SMA20 and even the 3,800s as potential tests rather than definitive trend breaks, unless the SMA50 begins to fail.
If and when external forecasts are available in future snapshots, we will explicitly cite and link to them, comparing their evidence and methodology to the on-chain, price-based, or indicator-driven arguments observed in the data.
Risk Factors & What Could Invalidate The Setups
Technical setups are probabilistic, not deterministic. The following factors could challenge or invalidate the scenarios described above:
- Sharp momentum reversal: A quick transition from an RSI above 70 to sub-50 readings, alongside a bearish cross in MACD (MACD falling below its signal line), would indicate momentum is not just cooling but turning. While we cannot observe that cross without future data, it is a standard signal to watch.
- Loss of the 4,000 handle without immediate recovery: A decisive breakdown through 4,000 that fails to attract buyers could accelerate a move toward the SMA20 (3,767.73). If the SMA20 does not stabilize price, the narrative shifts from consolidation to a deeper pullback.
- Break of the SMA20 on a closing basis with follow-through: This would signal that near-term trend support is compromised. The next key reference would be the SMA50 (3,194.57). A failure near the SMA20 does not automatically target the SMA50, but it opens the pathway for a more pronounced mean reversion.
- Failure at 4,300 followed by lower highs: If multiple attempts to clear 4,300 are rejected and each subsequent rally tops at a lower level, it would be an early sign of distribution. In such cases, price often migrates to test the lower bound of the consolidation, potentially around 4,080–4,100, and then toward 4,000.
- Volatility expansion without directional progress: Wide intraday ranges that fail to resolve above 4,300 or below 4,080 increase whipsaw risk, reducing the reliability of short-term signals and encouraging a waiting approach until the next directional break.
Within this risk matrix, it is useful to map invalidations to time horizons:
- Intraday to very short term: Loss of 4,200–4,250 after a breakout attempt above 4,300 undermines immediate bullish continuation.
- Short term (multi-day): Closing below 4,080 increases the probability of a move toward 4,000–4,020; losing 4,000 opens the SMA20 zone.
- Intermediate term (multi-week): Only a failure around the SMA50 (3,194.57) and the inability to reclaim the SMA20 thereafter would meaningfully threaten the broader uptrend structure implied by this snapshot.
Additional Observations and Tactical Considerations
Without introducing external data, we can still discuss practical techniques for operating within the current technical environment:
- Buying strength vs. buying weakness: In a strong uptrend with an overbought RSI, many practitioners prefer buying weakness into predefined support zones (for example, minor pullbacks into 4,150–4,200 or deeper into 4,000–4,050) rather than chasing breakouts, unless the breakout comes after a tight, low-volatility consolidation.
- Using moving averages as bias filters: Above the SMA20 and SMA50, the default bias is up. Pullbacks toward the SMA20 are often treated as opportunities to test bullish resolve. If price were to spend time below the SMA20, patience becomes warranted until a reclaim is confirmed.
- RSI regime monitoring: Sustained RSI above 60–70 often characterizes strong trends. A drop of RSI into the 40s while price remains elevated could reflect hidden distribution and merits caution.
- MACD confirmation: As long as MACD stays above its signal line, momentum is structurally supportive. A cross below the signal line would not automatically end the trend but would reduce the probability of immediate continuation and bolster the consolidation or pullback case.
- Round-number psychology: In crypto, round levels like 4,000, 4,300, and 4,400 can attract order flow and shape intraday battles. Recognizing these zones can improve trade location and risk definition when other data is limited.
Putting It All Together
The weekly picture for ETH-USD is constructive with a strong cautionary overlay. The uptrend is evident: price is 12.99% above its SMA20 and 33.26% above its SMA50, and the MACD is positive relative to its signal line. The caution stems from the RSI at 72.95, which points to an overbought short-term state where the path of least resistance may alternate between brief breakouts and consolidations or controlled pullbacks.
From a planning perspective, the most pragmatic approach is to recognize two active regimes at once. On the one hand, the intermediate trend is up, as evidenced by moving averages and MACD, making dip buying in controlled pullbacks a sensible tactic. On the other, the overbought RSI argues for patience on new entries at highs and vigilance around 4,300–4,400, where rejections could temporarily dominate. This duality is a hallmark of healthy but extended uptrends.
Next week’s focal points therefore cluster around: the reaction to 4,300; whether 4,080–4,100 holds on pullbacks; and how quickly buyers present themselves near 4,000 if tested. If the market can consolidate above 4,080 and then break decisively through 4,300, the odds of a 4,400–4,550 extension improve. Conversely, persistent failures at 4,300 that drive price back below 4,080 would favor a revisit of 4,000 and possibly the SMA20 area.
What to Watch Day by Day
For participants who monitor intraday developments to validate these weekly setups, consider the following checkpoints:
- Opening posture relative to 4,250: Early strength above this area suggests buyers remain engaged; weakness below increases the odds of testing 4,200–4,220.
- Behavior at 4,300: One punch through 4,300 is less informative than whether price can hold above it on retests. Persistent acceptance above 4,300 favors the bullish scenario.
- RSI drift: A controlled drift of RSI toward high 60s with price consolidating sideways is consistent with digestion. A sharp RSI drop into the 50s while price falters near supports warns of momentum loss.
- MACD-signals on lower timeframes: While our snapshot is anchored to daily-style indicators, intraday MACD crosses can give clues about when a pullback is stabilizing. Watching for re-crosses higher near 4,100–4,200 can help time entries.
Limitations of the Snapshot and Data-Use Discipline
This analysis strictly adheres to the provided dataset. We have not introduced external price history or news context, and we have resisted the temptation to retrofit broader narratives. As a result, some inferences—such as resistance at round numbers—are presented as heuristics rather than empirically derived supply zones. Moving averages and oscillators are the most robust signals here; psychological levels are secondary guides.
For readers seeking a richer picture, integrating additional context—such as multi-month price structure, volume, or volatility measures—would improve precision around breakout quality and support durability. However, within the bounds of this snapshot, the directional skew remains clear: intermediate uptrend intact, short-term overbought, with key levels at 4,300 (resistance), 4,200–4,220 (near-term support), 4,000 (support), and the SMA20/SMA50 bands below.
Conclusion
ETH-USD enters the week from a position of technical strength: price has rallied 14.47% week over week to 4,256.95, sits well above the SMA20 (3,767.73) and SMA50 (3,194.57), and carries a positive MACD profile. The sole near-term cautionary flag is an RSI at 72.95, which elevates the probability of consolidation or a mild pullback even as the intermediate uptrend remains intact.
Key tactical implications:
- Respect the trend: Until price meaningfully challenges the SMA20, assume the path of least resistance remains up on an intermediate basis.
- Be selective at highs: Given overbought conditions, look for either a convincing breakout and hold above 4,300 or for pullbacks into 4,100–4,200 and potentially 4,000 to manage risk.
- Use moving averages: The SMA20 is a critical short-term gauge; the SMA50 marks a more strategic line where trend definition would be reevaluated if tested.
The market’s next act likely unfolds as either consolidation beneath 4,300 with eventual breakout attempts, or a controlled reset toward 4,000–3,800 to refresh momentum. Both paths can coexist with a still-bullish intermediate trend, so scenario discipline and level awareness remain paramount.
Editorial Statement
This research is presented for informational and educational purposes only and does not constitute investment advice, an offer, or a solicitation to buy or sell any asset or to adopt any investment strategy. The analysis relies solely on the technical indicators and values provided in the supplied snapshot and is not a comprehensive assessment of Ethereum, crypto markets, or broader macro conditions. Trading and investing in digital assets involve substantial risk, including the risk of total loss. Past performance and historical indicator behavior are not reliable predictors of future results. You are solely responsible for your own investment decisions, and you should consider consulting a qualified, independent financial professional who can assess your specific objectives, constraints, and risk tolerance. We make no warranty as to the accuracy, completeness, or usefulness of this information and disclaim liability for any losses arising from reliance on it.