Solana (SOL-USD) Weekly Technical Analysis – Momentum Builds Above Key Averages, RSI Firm, MACD Positive
Executive Summary
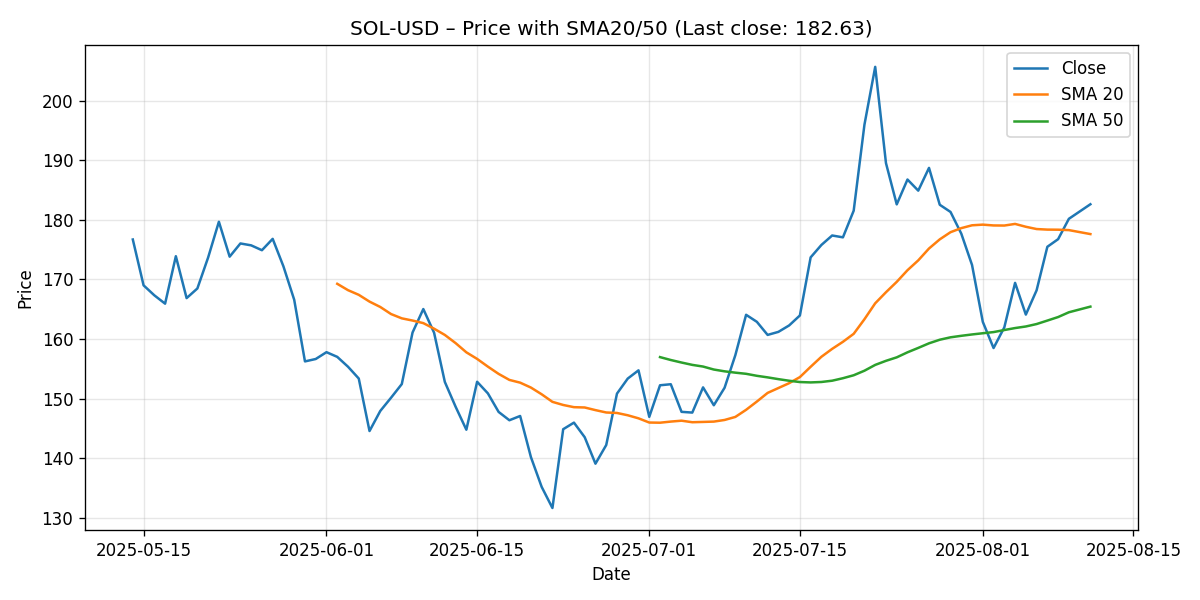
Over the last seven days ending 2025-08-11, Solana (SOL-USD) advanced 7.79% week-over-week to close at 182.63. The rally firmed the token’s technical posture: price sits above the 20-day simple moving average (SMA20) at 177.62 and well above the 50-day simple moving average (SMA50) at 165.44. Momentum is constructive but not stretched; the 14-day Relative Strength Index (RSI14) printed 57.82—comfortably above the neutral 50 line yet still below overbought territory (>70). The Moving Average Convergence Divergence (MACD 12/26/9) remains positive at 1.68, above its signal line at 1.55, with a modestly positive histogram of roughly 0.14. Collectively, these signals depict a market in a tactically bullish phase with room to extend if buyers can defend nearby supports and press into psychological resistance zones.
From a structural perspective, the configuration of the moving averages—SMA20 above SMA50—reinforces an established uptrend on the intermediate timeframe. At the margin, the week’s gain (~+7.8%) implies improved demand relative to the prior week’s close (implied near ~169.4), and the current price trades approximately 2.8% above the SMA20 and roughly 10.4% above the SMA50. Such distances are supportive of trend continuation but also leave scope for routine pullbacks—especially toward the SMA20—without damaging the broader bullish structure.
Key tactical levels into next week include support near the SMA20 (around 177.6) and deeper support near the SMA50 (around 165.4). On the upside, psychological round numbers at 190 and 200 will likely act as resistance unless momentum accelerates. Our scenario analysis for the coming week sets the following reasonable ranges: bullish 190–202, most-likely 176–192, and bearish 168–176. The bullish path assumes sustained closes above the SMA20 with improving momentum; the bearish path contemplates a failure at or beneath the mid-180s and a break below the SMA20 that drives a test of the mid-160s trend base. The most-likely scenario envisions range behavior around existing moving averages with attempts to probe 190.
Longer-dated projections from external sources skew constructive, but they speak to a different horizon than this weekly analysis. Three recent forecasts posited substantial upside potential—$400–$500 within the bull run, $275 by end-2025 and $500 by 2029, and $520 by end-2025—underscoring a supportive macro narrative. Our focus here remains the next one to two weeks: trend-positive, momentum healthy, but respect those nearby supports as the line between routine digestion and a deeper mean-reversion.
Weekly Market Context & Trend
This week’s market context for SOL-USD is characterized by a relatively straightforward trend framework: the token closed at 182.63, up 7.79% over the seven-day window, and maintained positioning above both the 20-day and 50-day moving averages. That combination—price above the fast and intermediate moving averages and the fast average above the slower one—typically aligns with an ongoing uptrend rather than a topping phase. While the snapshot does not include intraday ranges or weekly highs and lows, the directional takeaway is clear: net buying pressure outweighed selling pressure across the week.
It’s constructive to consider the uptrend’s maturity through the lens of momentum and mean-reversion distance. With the last price about 2.8% above the SMA20 and roughly 10.4% above the SMA50, SOL has the kind of cushion that often accompanies steady uptrends. Pullbacks into the 20-day average are common even in healthy bull phases, while deeper retracements to the 50-day are typically seen when momentum wanes or when the market digests a prior leg higher more fully. In other words, the current spacing allows for a standard technical pullback to the SMA20 without necessarily shifting the intermediate trend.
Momentum conditions complement this message. The RSI14 at 57.82 indicates positive but not overbought buying pressure. Markets frequently cycle in the 55–65 RSI zone during sustained uptrends, with readings above 70 more often associated with overextensions that later consolidate. Meanwhile, the MACD at 1.68 sitting above its signal at 1.55 suggests bullish momentum remains intact; the positive histogram (~+0.14) implies bullish pressure is present even if not surging. For context, the MACD being above zero generally coincides with price action above medium-term moving averages, which is what we see here.
From a tactical standpoint, the week’s action likely saw buyers defending dips near or slightly below the low 180s and probing toward mid-to-high 180s. While we cannot infer precise intraday levels from the snapshot alone, the current configuration suggests that participants are comfortable accumulating on minor pullbacks so long as price maintains proximity to, or above, the SMA20. Round-number levels are also important in crypto order flow; hence, 180 and 190 tend to serve as behavioral milestones where liquidity often clusters. The next inflection for bulls is overcoming the 190 handle and ultimately pressing 200, while bears will look for a failure to hold the SMA20 that unlocks a deeper retracement toward the SMA50 in the mid-160s.
Detailed Technicals (Price + SMA20/50, RSI14, MACD 12/26/9)
Price and Moving Averages
Last close: 182.63. The 20-day simple moving average sits at 177.62, and the 50-day simple moving average at 165.44. With price above both, and SMA20 above SMA50, the trend posture leans bullish on the intermediate timeframe.
- Distance to SMA20: approximately +2.8% (price ~5.01 above SMA20).
- Distance to SMA50: approximately +10.4% (price ~17.19 above SMA50).
- Week-over-week change: +7.79%, implying a prior-week close near ~169.4.
These distances suggest trend persistence but also highlight the potential for routine mean-reversion. A pullback to the SMA20 would represent roughly a 2.7–3.0% decline from the current level, which is typical ebb-and-flow in an uptrend. A deeper retracement to the SMA50 would equate to roughly 9–10%, indicating a more notable shakeout but still potentially consistent with broader trend maintenance if buyers reassert there.
Strategically, many trend-followers will treat the SMA20 as a first line of support and the SMA50 as the trend-defining level. Consecutive closes below the SMA20 would warn that momentum is cooling; a decisive downside breach of the SMA50 would typically indicate a more material trend transition or at least a time-based consolidation ahead. For the coming week, monitoring how price behaves around 177–180 should be a high priority: a clean hold above that region could keep buyers confident, whereas multiple intraday breaches followed by weak closes might invite a test into the high 160s.
RSI14 (Momentum)
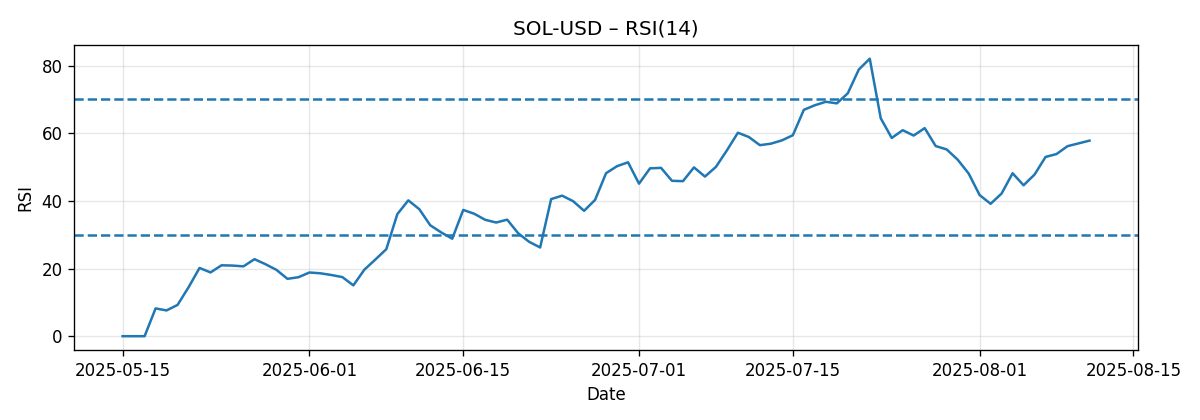
The 14-day RSI prints 57.82. This level is noteworthy on several counts:
- It sits above the midline (50), which generally favors buyers and supports the case for higher lows forming on pullbacks.
- It remains below overbought thresholds (70+), implying there is additional room for price to advance without immediately triggering typical RSI-based mean-reversion dynamics.
- It lies within a band (roughly 55–65) that often characterizes sustainable trend phases rather than blow-off tops.
For short-term traders, the RSI’s behavior around the 50–55 region is often a tell. If the coming week’s pullbacks maintain RSI above 50 and ideally pivot higher from 52–55, momentum is likely cycling within a healthy uptrend. If RSI falls through 50 and stalls in the mid-40s, that would warn of a shift toward a range or corrective phase. Because RSI is a derivative of price, it should be interpreted together with the moving averages: a hold above the SMA20 with RSI churning between 55–65 is classically supportive of upward continuation; a breakdown beneath the SMA20 with RSI slipping under 50 strengthens the bear case to test the SMA50.
MACD (12/26/9)
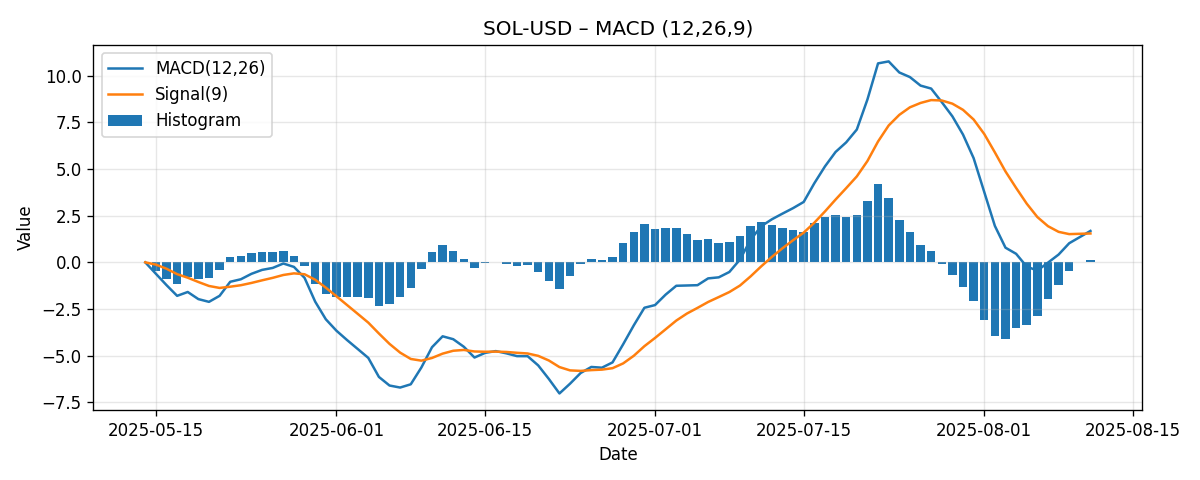
The MACD line stands at 1.68 versus a signal line at 1.55, producing a positive histogram of about +0.14. The positive reading and positive spread to the signal line indicate ongoing bullish momentum. While the magnitude of the spread is modest, the direction matters: a widening positive histogram would confirm acceleration; a narrowing one would hint at momentum fatigue even if price remains elevated.
- MACD > 0: aligns with price trading above intermediate moving averages and a constructive trend background.
- MACD > Signal by ~0.14: bullish momentum still in force, though sensitive to short-term pullbacks.
Key tells for the week ahead: watch whether the histogram expands or contracts. Expansion would likely coincide with pushes into 188–190 and potentially a probe of 200. Contraction, particularly if paired with a loss of the SMA20, would point to a drift toward the 170s and a risk of testing 165–168. The first concrete warning would be a bearish MACD crossover (MACD falling below the signal line), especially if it occurs while RSI is rolling under 50—together, those would elevate the probability of a move toward the SMA50.
Key Levels (Support/Resistance)
Based on the provided snapshot, the following levels are technically significant. Supports are drawn from the moving averages and round-number behavior often seen in crypto markets; resistances focus on nearby psychological thresholds that frequently attract order flow. Distances are measured from the last close at 182.63.
| Level | Type | Rationale | Distance from Last Close |
|---|---|---|---|
| 200.00 | Resistance | Major psychological round-number; likely liquidity zone and potential profit-taking area. | +9.5% |
| 190.00 | Resistance | Psychological level; first upside milestone above the mid-180s. | +4.0% |
| 182.63 | Pivot (Last Close) | Reference point for week-ahead bias; sustained trade above favors buyers. | 0.0% |
| 180.00 | Near-term support | Round-number area; potential intraday support/resistance flip zone. | -1.4% |
| 177.62 | Support (SMA20) | First dynamic support in an uptrend; routine pullbacks often stabilize here. | -2.8% |
| 165.44 | Support (SMA50) | Trend-defining support; a deeper test would still be compatible with a broader uptrend if defended. | -9.4% |
These levels provide a framework rather than precise inflection points. Market structure often forms zones rather than single ticks. For example, the 177–180 band blends a round number and the SMA20; similarly, 190–200 blends a minor and a major psychological level. Expect liquidity and reactions to cluster across these ranges.
Scenario Analysis (Next Week)
With trend and momentum supportive but not overextended, the week-ahead scenarios hinge on how price behaves around the SMA20 and whether buyers can carry SOL through the mid-to-high 180s into the 190 handle.
Bullish Scenario
- Assumptions: Price holds above the SMA20 (≈177.6) on daily closes; RSI stays ≥55 and pivots higher; MACD histogram stabilizes or expands positively.
- Triggers: Early-week bids defend 180–178; a push through 186–188 with follow-through toward 190; intraday dips find buyers above 180.
- Projection (next week): 190–202. A decisive break and hold above 190 opens a probe toward the 200 round number. If momentum expands, a brief overshoot into the low 200s is possible, though sustained trade above 200 would likely require fresh catalysts and stronger momentum than currently indicated.
- Invalidation: A daily close below the SMA20 with momentum rolling over (RSI slipping toward 50, MACD histogram contracting) would downgrade this scenario.
Bearish Scenario
- Assumptions: Price fails to clear the mid-to-high 180s, sellers fade bounces, and daily closes slip below the SMA20.
- Triggers: Rejection near 186–190; multiple failed attempts to reclaim 180–182 after a breakdown; momentum indicators trend lower with RSI below 50 and MACD crossing below its signal.
- Projection (next week): 168–176. This range contemplates a test of the mid-to-high 170s initially, with follow-through into the high 160s if selling pressure intensifies. The 165–168 area aligns with the SMA50 zone as a logical destination for a deeper mean-reversion.
- Invalidation: Reclaiming and holding above 182–185 quickly after breakdown, paired with improving momentum, would neutralize the bearish path.
Most-Likely Scenario
- Assumptions: The market digests gains with two-sided trade around the SMA20; momentum stays constructive but contained (RSI ~55–62, MACD positive but not accelerating).
- Behavior: Dips into 178–180 find buyers; rallies into 188–190 meet supply; daily closes cluster near low-to-mid 180s.
- Projection (next week): 176–192, with a slight upward bias if 180 continues to act as a springboard. Within this range, a weekly close near 182–188 would align with consolidation before any larger move.
- Shift to alternative: A swift, high-volume break of 190 that holds would tilt probabilities toward the bullish scenario; sustained closes below 177.6 would shift them toward the bearish scenario.
Comparative Outlook: External Predictions vs. This Weekly View
Three external forecasts offer a longer-horizon backdrop:
- CoinDesk (Analyst view): “A popular crypto analyst predicts SOL could surge to $400–$500 during the current bull run.”
- Standard Chartered: “Standard Chartered forecasts SOL at $275 by end-2025 and $500 by 2029.”
- VanEck (model-based): “VanEck estimates SOL could reach $520 by end-2025 using an autoregressive forecast model.”
All three point to substantial potential upside on multi-month to multi-year horizons. At the current price of 182.63, for example, a move to 275 (Standard Chartered’s 2025 target) would be a sizeable advance, and the $400–$520 corridor would imply outsized gains. However, these projections are not directly actionable for the next one to two weeks; they reflect broader-cycle narratives and modeling assumptions rather than near-term technical structure.
Where our view aligns: this week’s technicals are consistent with an uptrend in progress—price above the 20/50-day SMAs, RSI above 50, and MACD positive—so the directional backdrop does not contradict higher long-term targets. Consolidation followed by trend continuation is a common pathway for assets that ultimately make significant multi-month advances.
Where our view diverges (or, rather, is orthogonal): the weekly lens emphasizes risk management around nearby supports (177.6 and 165.4) and the behavior into 190/200. We refrain from extrapolating short-term momentum into long-term price targets. The external forecasts may be correct over the specified horizons, but their resolution is low for next week’s positioning. As a result, our approach emphasizes conditional levels and scenario thresholds rather than long-horizon price anchors.
In practical terms, the path from 182.6 to, say, 520 (VanEck’s year-end estimate) would require a series of successful trend extensions, likely punctuated by routine corrections. This week’s data suggest the first of those steps is intact: a healthy trend posture with momentum support. Whether the next step is a clean breakout through 190–200 or a consolidation near the SMA20 will likely set the tone for subsequent weeks. Hence, while we acknowledge the bullish long-term narratives, our actionable focus remains on how SOL navigates the 177–180 support band and the 190/200 resistance band in the immediate term.
Risk Factors & What Could Invalidate The Setups
Technical setups fail; risk management hinges on recognizing invalidation early. Below are the key technical risks and broader market considerations that could undermine the scenarios laid out:
Technical Invalidation Signals
- Daily closes below the SMA20 (≈177.6), especially if accompanied by an RSI breakdown below 50 and a MACD bearish crossover (MACD falling below signal). This trio would transition the bias from “buy-the-dip” to “wait-and-see.”
- A decisive weekly close near or below the SMA50 (≈165.4). That would suggest the intermediate uptrend is at risk, raising odds of a broader consolidation phase or a trend change.
- Failure at 190 with multiple rejections and lower daily highs in the mid-180s. This pattern would indicate supply dominance at resistance and a market losing upward momentum, encouraging mean-reversion toward the 170s.
Market Structure and Liquidity
- High-volatility washouts: Crypto markets often exhibit rapid, leveraged cascades. Even in uptrends, swift intraday losses can temporarily breach supports before price recovers. Such events can trigger technical sell signals that later reverse, complicating execution.
- Round-number gravity: Liquidity tends to cluster around 180, 190, and 200. These levels can act as both magnets and barriers, causing slippage and false breaks.
Macro and Ecosystem Considerations
- Regulatory headlines: Sudden changes in crypto policy, enforcement actions, or exchange-related developments can shift risk sentiment regardless of technical posture.
- Correlation shocks: SOL’s behavior can be influenced by broader crypto beta. Large directional moves in benchmark assets can override coin-specific technicals even if SOL’s own indicators look benign.
- Network performance: While not addressed in the snapshot, operational stability is a non-technical factor that can influence short-term flows. Outages or congestion episodes can temporarily alter technical dynamics by affecting trader confidence.
In all cases, the simplest and most reliable technical invalidation cues remain the levels we can quantify here: loss of the SMA20 raises caution; loss of the SMA50 demands a reassessment of the intermediate trend; sustained trade above 190 and especially above 200 would strengthen the case for a trend extension.
Putting It All Together
As of the 2025-08-11 snapshot, SOL-USD exhibits a solid intermediate uptrend: price above SMA20/SMA50, RSI above 50 at 57.82, and MACD positive and above its signal. Those are the hallmarks of a constructive backdrop with scope for additional upside if buyers can overcome nearby resistance. The week-over-week gain of 7.79% corroborates improved sentiment and positioning.
Yet, within this positive context, discipline around key levels is essential. The 177–180 band is the battlefield for maintaining control; if buyers win there, a push to 190, and possibly an attempt at 200, is reasonable. If sellers force closes beneath 177.6, the market likely pivots to discovery down toward 170–168 and potentially the 165 area around the SMA50. Momentum gauges should be monitored for confirmation: RSI holding 55–60 and MACD’s histogram staying positive would favor the bullish or most-likely scenarios; a roll under 50 on RSI and a MACD signal cross would favor the bearish one.
Relative to the longer-term forecasts from CoinDesk’s cited analyst, Standard Chartered, and VanEck, our weekly framework is more conservative by design. Their upside targets align with a bullish cycle narrative; our analysis focuses on the immediate tactical path and risk markers. The journey to those higher targets, if it occurs, will typically unfold through sequences of consolidations and breakouts around levels much like this week’s 177–180 supports and 190–200 resistances.
Editorial Statement
This report is an educational, technically oriented analysis based solely on the provided snapshot: last close 182.63, week change +7.79%, RSI14 57.82, MACD 12/26/9 at 1.68 with a 1.55 signal, and SMA20/SMA50 at 177.62/165.44. It incorporates three external long-horizon outlooks strictly as context. It is not investment advice, an offer, or a solicitation to buy or sell any asset. Digital assets are volatile and may not be suitable for all investors. Trading decisions should consider your objectives, experience, risk tolerance, and, where applicable, consultation with a qualified financial advisor. No guarantee is made regarding the accuracy, completeness, or future performance implied by this analysis. Markets can and do change quickly, and any scenario can be invalidated by new information.
Appendix: Quick Reference Numbers
- Ticker: SOL-USD
- Snapshot as of: 2025-08-11T08:07:40Z
- Last close: 182.63
- Week change: +7.79%
- RSI14: 57.82
- MACD (12/26/9): 1.68
- Signal line: 1.55
- MACD histogram: ~+0.14
- SMA20: 177.62
- SMA50: 165.44