XRP-USD Weekly Technical Analysis: Holding Above $3 With Mixed Momentum (Week of Aug 11, 2025)
Executive Summary
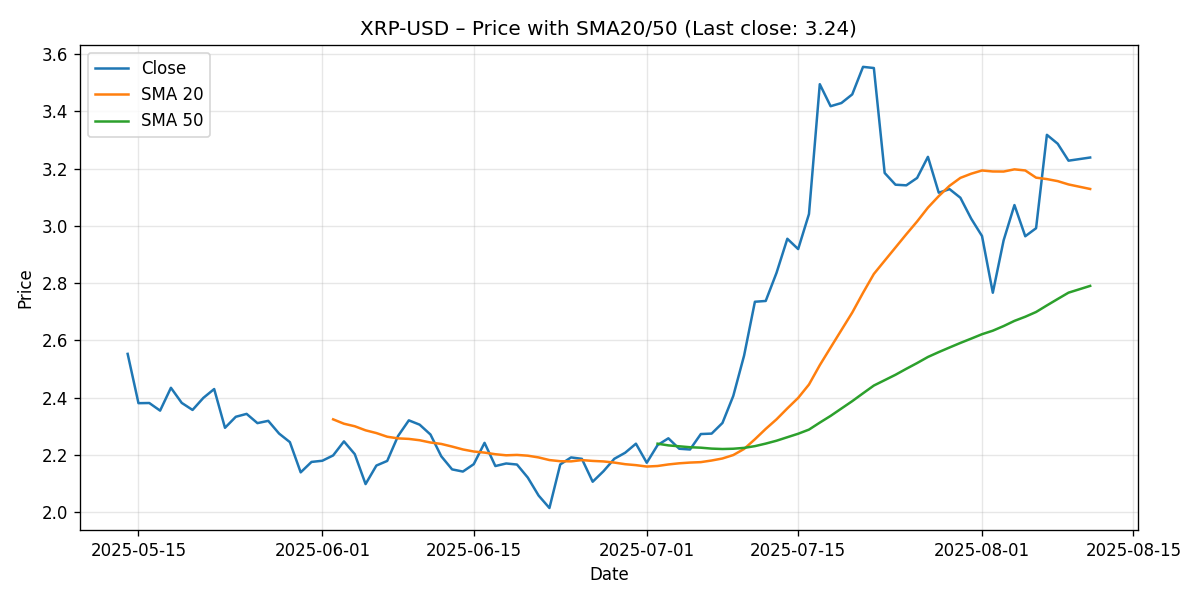
- Price action: XRP-USD closed the latest 7-day window at $3.239, up 5.41% week-over-week, sustaining a foothold above the widely watched $3.00 threshold.
- Trend positioning: Price sits above the 20-day simple moving average (SMA20 $3.129) and well above the 50-day simple moving average (SMA50 $2.790), indicating a constructive short- to intermediate-term trend structure.
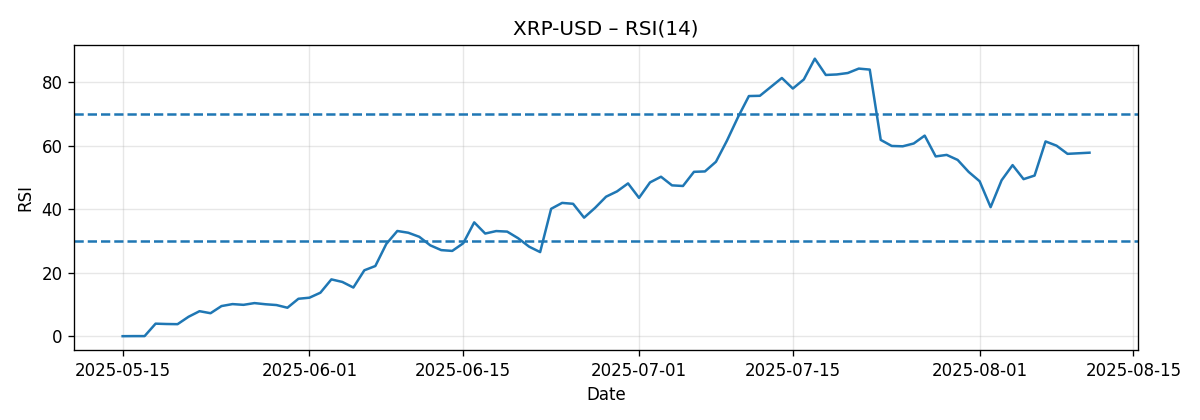
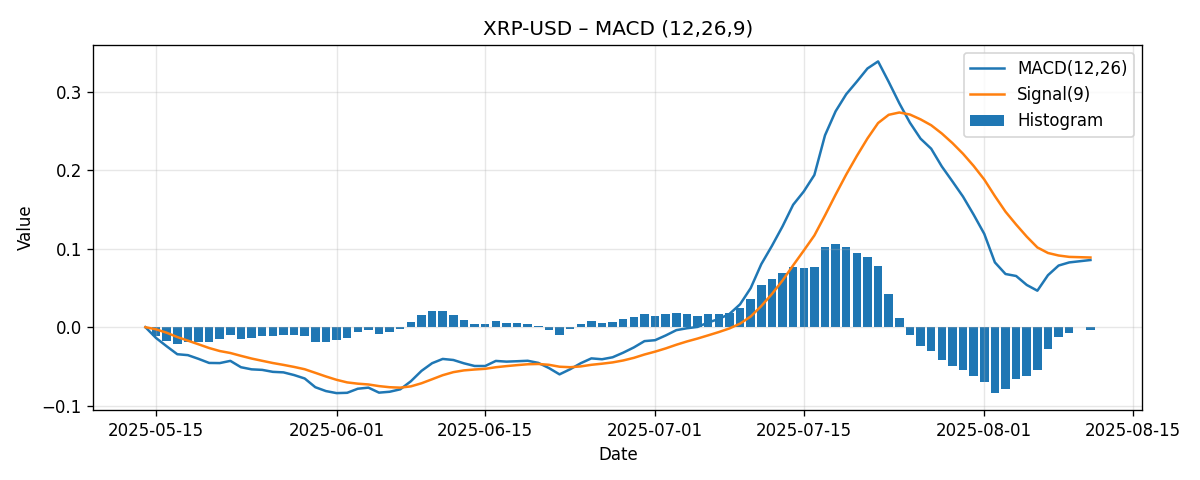
- Momentum profile: RSI(14) at 57.79 is neutral-bullish and not overbought; MACD (12/26/9) remains positive but is fractionally below its signal line (MACD 0.0855 vs. signal 0.0887), reflecting mildly waning upside momentum within an ongoing uptrend.
- Market takeaway: The technical posture is net supportive while acknowledging fading near-term momentum. The $3.00–$3.13 band (psychological plus SMA20) is the first test for trend durability; $3.30–$3.50 emerges as a tactical resistance zone for buyers to clear.
- Scenarios for the coming week:
- Bullish: A push through $3.30 could target $3.45–$3.80 if momentum re-accelerates.
- Most likely: Range trade between $3.10 and $3.50 as price consolidates above the 20-day moving average.
- Bearish: A loss of $3.00 could open a retest toward $2.79 (SMA50), implying $2.85–$3.05 near-term.
- External views:
- CoinDesk notes $3 as the level for bulls to beat; with XRP at $3.239, this threshold is presently exceeded.
- Finance Magnates cites a medium-term projection near $6.19; our weekly view is more measured given the current MACD-signal relationship.
- Cointelegraph cautions that $3+ predictions have a flaw and warns of risk toward $1 if key support fails; our risk analysis identifies $3.00 and $2.79 as the immediate levels to monitor for signs of deterioration.
Weekly Market Context & Trend
As of 2025-08-11, XRP-USD finished the latest 7-day window at $3.239, registering a 5.41% week-over-week increase. The past week thus extended XRP’s constructive posture in absolute terms and relative to its short- and intermediate-term moving averages. Holding above $3.00 has both technical and psychological implications. It signals that buyers remain in control on weekly cadence, while still leaving room for debate about the strength of incremental momentum.
Technically, the relationship of price to the 20-day and 50-day simple moving averages frames the trend backdrop:
- Price vs. SMA20: $3.239 is roughly $0.110 above the SMA20 ($3.129), or about 3.5%. That premium indicates near-term trend support remains intact.
- Price vs. SMA50: $3.239 is about $0.449 above the SMA50 ($2.790), or near 16.1% higher. This highlights a sturdier intermediate-term uptrend foundation.
The momentum context is nuanced. RSI(14) of 57.79 sits in neutral-bullish territory, reflecting neither overbought nor oversold conditions, while the MACD line (0.0855) sits marginally below its signal line (0.0887), leaving a small negative histogram (~-0.0032). This combination—positive price trend above MAs with slightly flagging momentum—often precedes either a period of consolidation or a shallow pullback that tests nearby support before trend resumption. In that sense, the weekly context is supportive but not unambiguously strong, inviting disciplined attention to key levels on both sides.
Detailed Technicals (Price + SMA20/50, RSI14, MACD 12/26/9)
Price and Moving Averages
Last close: $3.239. SMA20: $3.129. SMA50: $2.790. With price above both moving averages, the directional bias remains upward in the short-to-intermediate timeframes. The premium versus the SMA50 (about 16%) suggests the broader uptrend has room before a trend-neutral mean reversion would be tested. The smaller premium versus the SMA20 (about 3.5%) tells us the most immediate trend cushion is thinner, and thus the $3.10–$3.13 area could be sensitive if sellers attempt to press for a pullback.
Traders often treat the 20-day moving average as an initial demand zone within constructive trends. Paired with the psychological $3.00 mark, the $3.00–$3.13 cluster forms a logical near-term basin where dip buyers may first attempt to assert control, should price retrace. Conversely, an inability to hold above the SMA20 on a closing basis can sometimes lead to a move toward the SMA50, which in this case resides at $2.790.
RSI (14)
RSI(14) sits at 57.79, a level often associated with healthy, non-overextended conditions in rising markets. The fact that RSI is below 70 suggests there is no classical overbought reading on the weekly snapshot. Practically, that keeps the door open for either continued grind higher or a range-bound consolidation without requiring a deep reset on momentum grounds alone.
Interpreting RSI contextually:
- 50–60: Often indicates constructive momentum in an early or maturing advance; that is where XRP currently is (57.79).
- 60–70: A move into this zone could coincide with upside continuation if resistance zones are cleared.
- Below 50: Would warrant caution, as it could suggest a transition toward more neutral-to-bearish conditions.
As of now, RSI does not signal exhaustion. That said, the lack of a powerful over-60 reading may reflect the same moderation visible in MACD’s slight negative histogram. Together, they portray an uptrend that is intact but in need of fresh catalysts to accelerate.
MACD (12/26/9)
The MACD line is 0.0855 and the signal line is 0.0887, leaving the histogram modestly negative (~-0.0032). In trend terms, a positive MACD with a slightly negative histogram often reflects a pause or consolidation within an advance. Bulls tend to prefer a re-expansion of the histogram above zero (MACD crossing back above the signal) as confirmation that upside momentum is reasserting itself. Conversely, a deepening below-zero histogram coupled with price slipping under the SMA20 would increase the probability of a test of the SMA50.
Key MACD takeaways:
- Positive MACD: Underlying trend remains upward on the observed timeframe.
- MACD below signal: Short-term momentum is not yet re-accelerating; vigilance warranted near resistance.
- Trigger to watch: A renewed MACD-signal cross to the upside would likely coincide with clearing near-term resistance and could confirm a continuation attempt.
Key Levels (Support/Resistance)
The following levels synthesize observed moving averages, round-number psychology, and prevailing market context. Levels are not guarantees; they are reference points traders often watch for shifts in behavior.
| Level | Type | Rationale | Implication if Broken |
|---|---|---|---|
| $3.50 | Resistance | Round-number overhead; next notable waypoint above current price | Break could open $3.70–$3.80; would likely require MACD re-acceleration |
| $3.30 | Resistance | Near-term tactical cap ahead of last close; a logical trigger for bulls | Close above would support a push toward $3.45–$3.50 |
| $3.239 | Spot | Last 7-day window close; reference for intraposition risk management | Deviation from spot provides context for risk/reward skew |
| $3.13 | Support | SMA20 at $3.129; immediate trend gauge | Loss could invite test of psychological $3.00 and then $2.79 (SMA50) |
| $3.00 | Support | Psychological threshold; aligns with widely watched round number | Failure would weaken the immediate trend narrative |
| $2.79 | Support | SMA50; intermediate trend proxy | Break would shift bias toward corrective phase on this timeframe |
| $2.50 | Support | Psychological level below SMA50 | Would mark a deeper pullback; raises risk of trend change |
Scenario Analysis (Next Week)
These scenarios map plausible paths in the coming week based on current technicals. They are not predictions or guarantees; rather, they frame conditional expectations tied to levels and indicators observed in the snapshot.
Bullish Scenario
- Trigger conditions: A decisive push and hold above $3.30, ideally accompanied by a turn in the MACD histogram toward/above zero and an RSI drift toward the low-60s.
- Price projection (next week): $3.45–$3.80.
- Rationale: Price is already above SMA20 and SMA50, with RSI not overbought. Clearing near-term resistance could encourage momentum traders and trend followers to add exposure, pressing toward the $3.50 handle and potentially probing the upper-$3.70s if participation broadens.
- Risk to the bullish case: Failure to hold above $3.30 after a breakout attempt, or a further deterioration of the MACD histogram below zero, would suggest a false break and likely revert price back into the $3.10–$3.30 range.
Bearish Scenario
- Trigger conditions: A daily/weekly close below $3.13 (SMA20), quickly followed by a decisive loss of $3.00, signaling that near-term demand has weakened.
- Price projection (next week): $2.85–$3.05.
- Rationale: The MACD’s slight disadvantage vs. its signal line hints at softening momentum. If that coincides with a breach of the SMA20, price could gravitate toward the SMA50 ($2.79). The first reaction zone above the SMA50 is the upper-$2.80s to low-$3.00s.
- Risk to the bearish case: A quick reclaim of $3.13 and a turn higher in the MACD histogram would neutralize downside momentum and re-anchor price in the $3.10–$3.50 range.
Most-Likely Scenario (Base Case)
- Working assumption: Sideways-to-up consolidation above the SMA20 as participants assess the durability of the move above $3.00.
- Price projection (next week): $3.10–$3.50.
- Rationale: With RSI at 57.79 and price modestly above the SMA20, the path of least resistance appears to be stabilization with a slight upward bias. Absent a clear MACD re-acceleration, a range-bound week is plausible as the market digests gains and awaits a catalyst to target $3.50.
- Invalidation: A close below $3.00 would flip the base case toward the bearish scenario; a strong breakout above $3.30 that sustains would transition the base case toward the bullish trajectory.
Comparative Outlook: External Predictions vs. Our View
We evaluate three external perspectives to contextualize our weekly technical stance. Quotations are taken from the provided sources; our comments focus on how they intersect with the snapshot-driven view presented here.
1) CoinDesk: “$3 Is the Level for Bulls to Beat”
Source: CoinDesk
“A firm move to $3, the high registered on March 2, would invalidate the bearish setup.”
Alignment with our view: With XRP at $3.239 as of the latest 7-day close, the market is above the $3.00 line highlighted by CoinDesk. From our snapshot-based vantage point, price is also above SMA20 and SMA50, reinforcing that the immediate trend remains constructive. Where we remain cautious relative to the spirit of a “firm move” is momentum quality: our MACD reading is positive but slightly below its signal line, implying that while price has cleared $3.00, the market still seeks confirmation via re-accelerating momentum. In practice, we would look for a sustained hold above $3.00 and a push through $3.30–$3.50, ideally with a positive MACD inflection, to fully echo the “bearish invalidation” narrative.
2) Finance Magnates: Medium-Term Projection Around $6.19
Source: Finance Magnates
“Given this, my medium-term projection for XRP is around $6.19.”
Alignment and differences: The medium-term target cited is notably higher than current price. Our weekly lens is narrower by design, using SMA20/SMA50, RSI(14), and MACD to frame the next 1–2 weeks rather than the full year. On the weekly snapshot, XRP’s uptrend is intact (price above both SMAs, RSI neutral-bullish). However, the marginally negative MACD histogram tempers the immediacy of upside follow-through. We do not take a stance on the $6.19 medium-term figure here; instead, we note that for the weekly structure to start working toward materially higher levels, clearing nearer resistance ($3.30, then $3.50) with improving momentum would be constructive stepping stones. In other words, our timeframe-bound analysis neither contradicts nor endorses $6.19; it simply emphasizes that near-term momentum needs to re-engage before higher targets become actionable in a technical sense.
3) Cointelegraph: Caution on $3+ Predictions and Risk Toward $1 if Support Fails
Source: Cointelegraph
“XRP remains at risk of dropping to $1 if a key support zone is lost.”
How this fits our risk framework: Our near-term supports sit at $3.13 (SMA20), $3.00 (psychological), and $2.79 (SMA50). A failure of $3.00 and the SMA50 would indeed be meaningful deterioration on the weekly timeframe we’re tracking. While $1 lies far below these immediate references, the principle embedded in Cointelegraph’s point is sound: once successive support zones fail, downside can compound. Our approach is to monitor the nearer supports first; if they give way with momentum deterioration (e.g., deepening negative MACD histogram, RSI sliding below 50), the risk profile worsens. That dynamic aligns with the cautionary tone of Cointelegraph’s warning, even though our base case for the next week remains a consolidation above SMA20 rather than an unraveling.
Risk Factors & What Could Invalidate The Setups
Technical setups are contingent on evolving information. The following risks could alter or invalidate the scenarios outlined above:
- Momentum slippage persists: If MACD’s histogram stays negative and expands, and RSI pivots lower toward or below 50, the probability of losing the SMA20 and retesting the SMA50 rises materially.
- Loss of $3.00: A decisive close below $3.00 would undercut psychological support and likely embolden sellers, increasing the odds of a drift toward $2.79 (SMA50). Follow-through below the SMA50 would mark a more significant trend challenge.
- Headline-driven volatility: XRP is sensitive to crypto-wide risk sentiment, regulatory developments, and payments/ledger ecosystem headlines. Sudden news can cause outsized gaps through nearby technical levels, rendering otherwise orderly setups moot.
- Broader crypto market correlation: If benchmark crypto assets experience a risk-off wave, correlation can pull XRP lower even if XRP-specific signals are neutral. Conversely, a strong risk-on impulse could lift XRP through resistance faster than momentum indicators can react.
- USD strength/market liquidity: Shifts in dollar strength or market-wide liquidity conditions can influence crypto risk appetite, impacting the pace at which XRP challenges or defends key levels.
- Timeframe mismatch: The indicators cited are oriented to a daily/weekly lens. Intraday volatility can temporarily breach levels without confirming a larger timeframe break, and vice versa. Using mismatched timeframes can lead to misleading signals.
Putting It All Together
XRP’s weekly snapshot is technically constructive. Price is above both the SMA20 and SMA50, RSI remains in a healthy, non-stretched zone, and the $3.00 line—highlighted externally as a battleground—currently holds. The counterweight is the MACD-signal relationship, which is fractionally unfavorable and argues for patience near resistance. We therefore frame the coming week as a consolidation-biased environment with a path to upside extension if $3.30–$3.50 is cleared alongside improving momentum.
Practically, the $3.00–$3.13 area is the front line for trend defense. Holding that zone preserves the base case and leaves $3.30 as the next test for buyers. A convincing break above $3.30, ideally with a positive turn in the MACD histogram, increases the probability of probing $3.45–$3.50 and possibly the mid-to-high $3.70s thereafter. Conversely, a loss of $3.00 would turn attention to $2.79 (SMA50). That level’s integrity is central to maintaining the intermediate uptrend on this timeframe; losing it would force a reassessment toward a corrective outlook.
Editorial Statement
This analysis is for informational and educational purposes only and reflects a technical view based solely on the provided snapshot (price, SMA20/50, RSI14, MACD 12/26/9) and the three cited external articles. It is not investment advice, an offer, or a solicitation to buy or sell any asset. Digital assets are volatile and can result in total loss. Always do your own research, use risk controls appropriate to your circumstances, and consider consulting a licensed financial professional before making financial decisions.
Appendix: Indicator Snapshot
- Ticker: XRP-USD
- Snapshot generated: 2025-08-11T08:07:42Z
- Last close: $3.239
- Weekly change: +5.41%
- SMA20 (last): $3.129
- SMA50 (last): $2.790
- RSI(14): 57.79
- MACD (12/26/9): 0.0855
- MACD signal: 0.0887
Actionable Watch-Items for the Week Ahead
- Momentum confirmation: Watch for MACD histogram to uptick toward zero; if paired with a push above $3.30, momentum could re-align with price.
- Defend $3.00–$3.13: As long as this band holds on closing bases, the base case of consolidation with upward bias remains intact.
- Respect $2.79: If tested, this SMA50 level is a critical demarcation between orderly pullback and a deeper corrective phase.
- External sentiment: Track broader crypto tone; synchronized moves in majors often influence XRP’s ability to clear resistance or hold support.
Closing Thoughts
The current technicals present a balanced but constructive picture for XRP-USD. Price leadership above the 20-day and 50-day moving averages provides a sturdy backbone for the trend. RSI suggests there is room for the advance to continue without immediate overbought pressure. The principal caveat is momentum, as reflected in a slightly negative MACD histogram. If that resolves higher while $3.00–$3.13 continues to hold, odds favor an eventual attempt on $3.30–$3.50. If, instead, the momentum bleed deepens and price slips below $3.00, focus shifts to the SMA50 near $2.79 as the next line of defense. In short, the tape asks us to respect the current uptrend while remaining attentive to signals that would justify a tactical shift in expectations.