ADA-USD Weekly Technical Analysis: Short-Term Uptrend Firming as Price Rides Above the 20/50-SMA; Focus on $0.84–$0.86 Breakout vs. $0.78 Support
Executive Summary
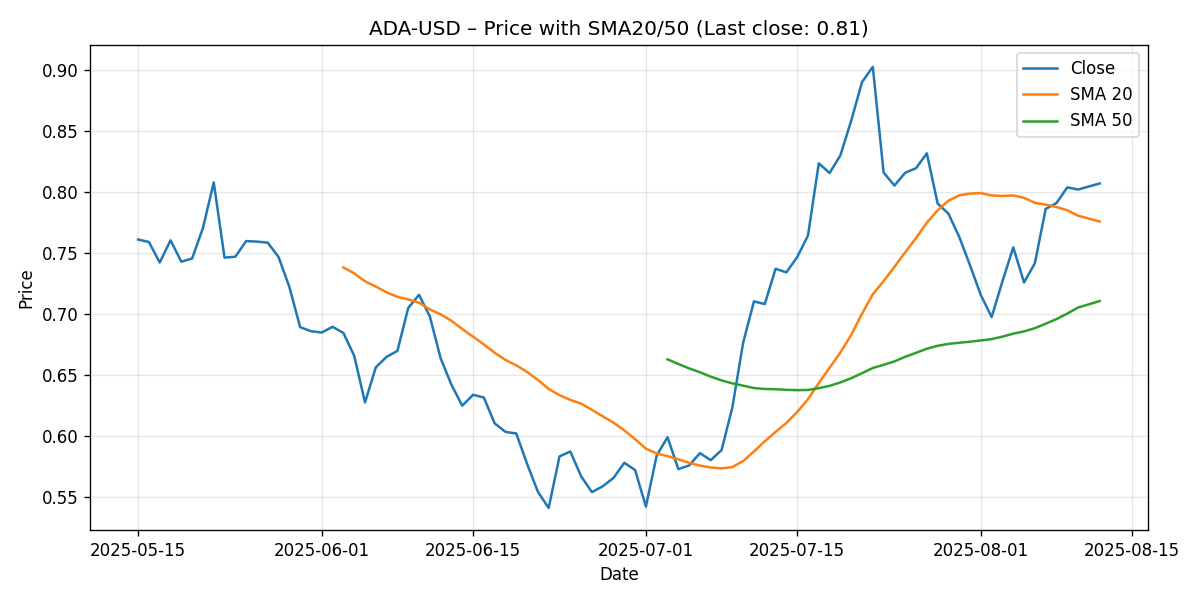
As of the latest seven-day snapshot generated on 2025-08-12, Cardano (ADA-USD) closed at $0.8073, advancing 11.19% week-over-week. The technical profile is constructive but not euphoric: the 14-period RSI sits at 58.72 (neutral-to-bullish), the MACD line (0.01436) is marginally above its signal (0.01315), and price trades above both the 20-day SMA ($0.7760) and the 50-day SMA ($0.7108). This establishes a short-term uptrend with growing, but still measured, positive momentum.
- Last close: $0.8073 (+11.19% over the last week).
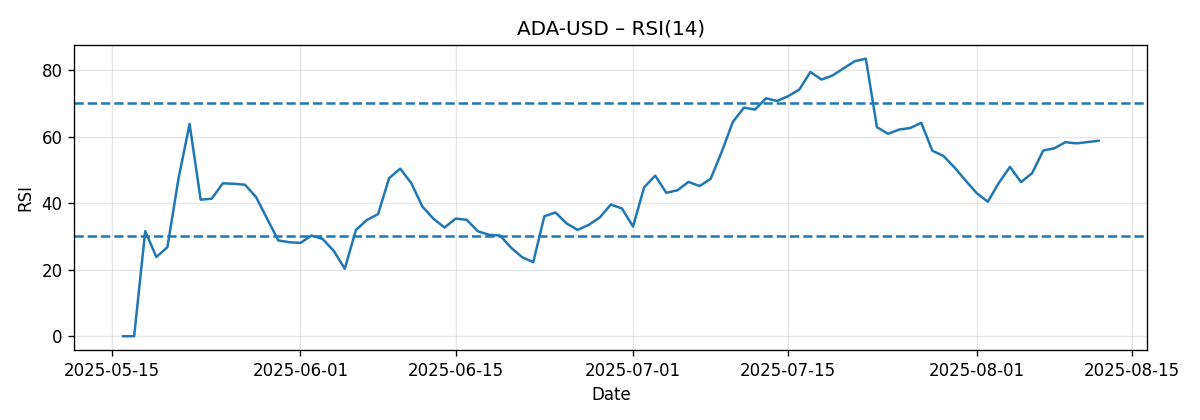
- RSI(14): 58.72 – room before overbought territory (typically ~70).
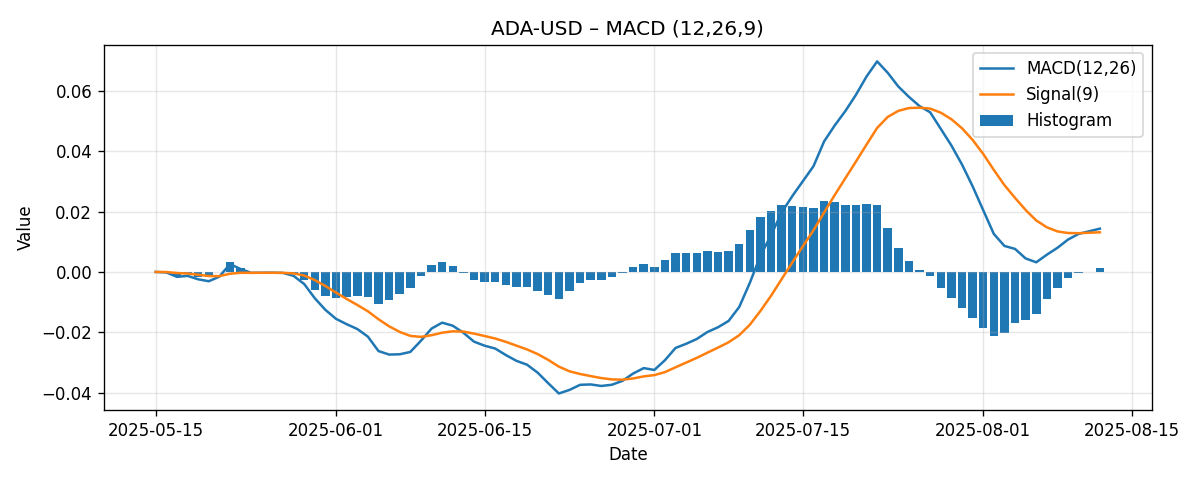
- MACD(12,26,9): 0.01436 vs. signal 0.01315 – positive but shallow histogram (~0.00120).
- SMA20: $0.7760; SMA50: $0.7108 – price above both; SMA20 sits above SMA50.
- Immediate resistance band: $0.84–$0.86, per external references and recent market reactions.
- Supports: $0.80 (round), $0.776 (SMA20), and $0.71 (SMA50) with an intermediate watch at $0.78.
Bottom line: Momentum is positive but not exuberant. A clean daily close above $0.84 would set up a test of $0.86 and potentially open an extension toward $0.90–$0.93, whereas failures below $0.80/$0.78 could drag price back toward $0.76–$0.72. Next week’s bias is cautiously bullish with a preference for range-trading unless the $0.84 threshold is decisively breached.
Weekly Market Context & Trend
ADA’s 11.19% gain over the last seven days marks a constructive rebound phase in which buyers regained control from a mid-cycle neutral posture. The move lifted spot to $0.8073, positioning it meaningfully above short- and intermediate-term trend gauges:
- Price vs. 20-day SMA: approximately +$0.0313 (+4.0%).
- Price vs. 50-day SMA: approximately +$0.0965 (+13.6%).
- 20-day SMA vs. 50-day SMA: roughly +$0.0652 (+9.2%), indicating short-term average outpacing the intermediate-term average.
These relationships typically characterize a short-term uptrend with initial trend confirmation. The RSI at 58.72 supports that view; it suggests positive momentum, yet remains well below overbought conditions, leaving room for further upside if buyers persist. The MACD, hovering above its signal line, adds to the bullish tilt, though the histogram is modest, reminding us that the rally is still in its early or rebuilding stages rather than an extended blow-off move.
External context from the week’s coverage highlights a cluster of overhead levels:
- FXStreet (Aug 11) notes, “If ADA closes above $0.84, it could extend the rally toward its July 21 high of $0.93.” (link)
- FXStreet (Aug 8) highlights a “$0.8599” target level, last tested on July 23. (link)
- FXStreet (Aug 6) warned of a sell signal and the risk of a “death cross” based on EMAs on a referenced timeframe. (link)
Those notes dovetail with our observation that the $0.84–$0.86 area is the critical pivot for ADA’s near-term trajectory. However, given our current snapshot’s data, short-term trend signals lean bullish: price above both 20- and 50-SMAs, RSI mid-to-upper 50s, and a positive MACD line. The key market question into next week is whether ADA can convert its constructive setup into a break of that overhead supply band, or whether it pauses to consolidate gains back toward support.
Detailed Technicals
Price Action and SMAs
Latest close: $0.8073. The technical significance of this close lies in its relationship with the moving averages:
- SMA20 (currently $0.7760): ADA is trading approximately 4.0% above this level. Sustained price action above the 20-day average often indicates that short-term momentum remains intact. The SMA20 itself is above the SMA50, adding an element of upward slope to the short-term trend structure.
- SMA50 (currently $0.7108): With ADA roughly 13.6% above the 50-day average, the intermediate-term trend is supportive. Pullbacks toward the 50-day are not uncommon in rising markets, but the distance provides a buffer against immediate trend deterioration.
From a tactical standpoint, the zone between $0.776 (SMA20) and $0.80 (round number) should be monitored as a demand pocket. This is typically where dip buyers attempt to reassert control if the market wobbles. Below that, $0.71 (SMA50) is a more critical trend guardrail; a decisive breakdown there would neutralize the short-term uptrend and push ADA back into a broader range-bound or corrective phase.
RSI(14)
RSI(14) at 58.72 indicates a neutral-to-bullish state. This is an important contextual cue: markets often exhibit the strongest trend continuation when RSI advances through the 50–60 zone and sustains above 50 on pullbacks. With ADA at 58.7, bulls have momentum but not to an overheated degree. A push through 60–65, especially in conjunction with a strong daily close above $0.84, would bolster confidence in an attempt toward the $0.86–$0.90 range.
Conversely, if RSI rolls over and loses the 50–52 area on any retracement, that would signal a loss of trend thrust and increase the odds of returning to the SMA20 or even the SMA50. Therefore, RSI’s behavior around the midline will be a key litmus test should price back off from resistance.
MACD (12, 26, 9)
MACD line: 0.01436; Signal line: 0.01315; Histogram: ~0.00120. The positive histogram confirms that momentum has tilted back in favor of buyers, but the magnitude is small, suggesting the move is young or tentative. Sustained positive histogram bars over several sessions would strengthen the case for a breakout.
However, a shallow positive histogram is also more vulnerable to whipsaws. If price stalls under $0.84 and slips below $0.80–$0.78, MACD could flatten and cross back under the signal. That would not necessarily end the broader basing effort, but it would elevate the risk of a deeper mean reversion toward the 50-day SMA.
Key Levels (Support/Resistance)
The following table summarizes the key levels visible from the snapshot data and recent external commentary:
| Level | Type | Basis / Rationale | Why It Matters | Confidence |
|---|---|---|---|---|
| $0.93 | Resistance | Referenced by FXStreet as July 21 high target on a breakout | Upper objective if $0.84–$0.86 clears with momentum | Medium |
| $0.86 | Resistance | FXStreet Aug 8 target ($0.8599) | Key waypoint; clearing it would validate upside extension | Medium-High |
| $0.84 | Resistance | FXStreet Aug 11 trigger for continuation toward $0.93 | Primary breakout trigger; a daily close above is constructive | High |
| $0.80 | Support | Round-number shelf near spot | First reaction zone on dips; loss would test lower supports | Medium |
| $0.78 | Support | Near-term swing area just above SMA20 | Fence before the 20-day; maintains short-term trend if held | Medium |
| $0.776 | Support | SMA20 | Trend pivot; loss raises risk of deeper pullback | High |
| $0.75 | Support | Psychological zone below the 20-day | Potential absorption area if $0.776 fails | Medium |
| $0.71 | Support | SMA50 | Intermediate trend guardrail; break would neutralize uptrend | High |
Scenario Analysis: Next-Week Outlook
Given ADA’s setup—price above the 20/50-SMA, mid-to-strong RSI, and a gently positive MACD—our baseline leans toward a constructive week with the caveat that overhead resistance at $0.84–$0.86 is consequential. Below are three scenarios with associated triggers and indicative price ranges for the coming week:
1) Bullish Breakout Scenario
- Trigger: A decisive daily close above $0.84, ideally with follow-through buying that pushes into or through $0.86.
- Momentum cues: RSI firming above 60–62; MACD histogram expanding positively.
- Projection (next week): $0.86–$0.90, with a stretch objective toward $0.93 if momentum accelerates.
- Invalidation: A swift reversal that closes back below $0.82–$0.81 after the breakout would suggest a failed move and raise whipsaw risk.
2) Bearish Rejection / Pullback Scenario
- Trigger: Failure to clear $0.84 followed by a daily close below $0.80 and sustained pressure into $0.78.
- Momentum cues: RSI rolling under ~50–52; MACD flattening and crossing below its signal.
- Projection (next week): $0.76–$0.72, approximating a retest of the SMA20 region first and potentially probing toward the SMA50 ($0.71) if selling intensifies.
- Invalidation: A swift reclaim of $0.82–$0.84 would negate the immediate downside impulse.
3) Most-Likely: Consolidation Within Range
- Trigger: Sideways trade under $0.84 with dips bought above $0.78–$0.776 (SMA20). This is consistent with a market catching its breath after a double-digit weekly advance.
- Momentum cues: RSI oscillating between 54 and 62; MACD positive but not expanding.
- Projection (next week): $0.78–$0.86. Rangebound price action would set the stage for a later directional break as indicators reset.
- Invalidation: A strong daily close above $0.86 (bullish) or below $0.776 (bearish) would likely end the range.
Comparative Outlook: How Our View Aligns or Differs From External Calls
FXStreet (Aug 11): “If ADA closes above $0.84, it could extend the rally toward its July 21 high of $0.93.”
“If ADA closes above $0.84, it could extend the rally toward its July 21 high of $0.93.”
Our take: This aligns with our resistance framework and breakout scenario. With price above both the 20- and 50-day SMA, RSI at 58.7, and a slightly positive MACD, the technical underpinnings support the idea that a clean $0.84+ daily close could draw in follow-through buying. We concur that $0.93 is a reasonable extension target if the breakout is confirmed. The difference is nuance: our base case first looks for stabilization in the $0.86–$0.90 interval before a potentially tougher push to $0.93, given the modest MACD histogram and the likelihood of supply pockets within that zone.
FXStreet (Aug 8): “With bulls targeting the $0.8599 level, last tested on July 23.”
“with bulls targeting the $0.8599 level, last tested on July 23.”
Our take: We treat $0.8599 (~$0.86) as the upper boundary of the immediate resistance band. Given the current indicators, that target is consistent with our bullish scenario’s initial objective after a $0.84 breakout. We also note that a test of $0.86 may encourage some profit-taking; thus, in our path dependency, we anticipate a possible pause or minor consolidation in the $0.86–$0.90 range before attempting higher levels. This is not a disagreement with the FXStreet target but a layering of tactical expectations in how price might traverse the zone.
FXStreet (Aug 6): “Declining 50-period EMA nears the 200-period EMA, increasing the death cross chances.”
“Declining 50-period EMA nears the 200-period EMA, increasing the death cross chances.”
Our take: That cautionary note relates to EMA dynamics on a specified timeframe. In our current snapshot, we analyze SMA20 and SMA50, which are both positioned supportively for the short term (price above both; SMA20 above SMA50). The discrepancy underscores that timeframe and indicator choice matter. A potential EMA-based death cross at a longer horizon can coexist with a shorter-term SMA-based uptrend. Practically, this means traders should respect the $0.84–$0.86 resistance while keeping risk controls tight: should ADA fail at resistance and roll over, the longer-horizon risk highlighted by FXStreet could reassert itself. Our near-term bias is constructive, but we acknowledge the medium-term caution embedded in their note.
Risk Factors & What Could Invalidate the Setups
While the technicals tilt positive, crypto markets are inherently volatile and can pivot rapidly. Key risks include:
- Overhead supply concentration: The $0.84–$0.86 zone has multiple reference points. Even with a breakout attempt, inadequate momentum could produce a failed breakout and fast downside.
- Momentum fragility: The MACD histogram is only slightly positive. Minor pullbacks can quickly flip the signal, especially if price slips below $0.80 and tests $0.78–$0.776.
- Higher-timeframe moving average risks: External commentary notes potential EMA cross concerns on a longer timeframe. If broader trend headwinds reassert, short-term gains can unwind quickly.
- Derivative positioning and open interest: As referenced by FXStreet, climbing open interest can amplify both upside and downside. If positioning becomes one-sided, sharp liquidations can whipsaw price across nearby levels.
- Market-wide beta: ADA is sensitive to macro crypto sentiment. Sudden shifts in broader digital asset risk appetite, regulatory headlines, or liquidity conditions can override local technicals.
Invalidation markers for our near-term constructive bias include:
- A daily close below the SMA20 ($0.776), especially if accompanied by RSI losing the 50 area and a negative MACD cross.
- Loss of $0.75 on follow-through selling, opening risk toward the SMA50 (~$0.71).
- Persistence under $0.84 despite multiple tests, coupled with weakening momentum; this would increase the probability of a range breakdown rather than a breakout.
Tactical Takeaways
- Trend: Constructive short-term uptrend; price above 20/50-SMA; SMA20 above SMA50.
- Momentum: RSI 58.7 supports upside potential; MACD positive but modest.
- Key trigger: $0.84 breakout pivot; $0.86 is the next test; $0.93 is the extension target per external reference.
- Supports to watch: $0.80, $0.78, $0.776 (SMA20), $0.71 (SMA50).
- Most-likely next week: Range trade $0.78–$0.86 unless a decisive break occurs.
Methodology & Indicator Notes
This weekly review emphasizes objective, price-based indicators from the provided seven-day snapshot and standard technical interpretation frameworks:
- Price relative to SMA20 and SMA50 to gauge short- and intermediate-term trend.
- RSI(14) to assess momentum balance; sub-70 suggests no overbought condition.
- MACD(12,26,9) and histogram to evaluate momentum shifts and potential signal strength.
We avoid introducing data not in the snapshot and rely on external sources solely for explicitly provided insights. Where ranges are presented, they are scenario-based, not guarantees, and are framed to align with typical technical behaviors around nearby supports and resistances.
What to Monitor Next Week
- Daily closes relative to $0.84 and $0.86: Confirmation or rejection will likely define next week’s path.
- RSI behavior: Holding above 55 during pullbacks is consistent with trend continuation; loss of 50 warns of deeper mean reversion.
- MACD histogram: Expansion supports the breakout case; contraction and a cross back below the signal warn of a stall.
- Holding patterns above $0.78–$0.776: This keeps the short-term uptrend intact even without a breakout.
Editorial Statement (Disclaimer)
This analysis is for informational and educational purposes only and reflects a technical interpretation of the specific snapshot provided. It is not investment advice, an offer, or a solicitation to buy or sell any asset. Digital assets are volatile and carry risk, including loss of principal. Always conduct your own research, consider your risk tolerance, and, where appropriate, consult a qualified financial professional before making trading or investment decisions.
Appendix: Snapshot Metrics Used
- Ticker: ADA-USD
- Snapshot generated at: 2025-08-12T15:23:05.699194Z
- Close (last): $0.80729
- Week change: +11.19%
- RSI(14): 58.7201
- MACD(12,26,9): 0.0143593; Signal: 0.0131548
- SMA20: $0.77603
- SMA50: $0.71080
External references discussed:
- FXStreet (Aug 11): Cardano Price Forecast: ADA bulls eye next leg higher as Open Interest climbs to $1.44 billion — “If ADA closes above $0.84, it could extend the rally toward its July 21 high of $0.93.” Link
- FXStreet (Aug 8): Cardano Price Forecast: ADA bulls set $0.86 target as network activity, Open Interest increases — “with bulls targeting the $0.8599 level, last tested on July 23.” Link
- FXStreet (Aug 6): Cardano Price Forecast: ADA flashes sell signal as whales holding, on-chain volume declines — “Declining 50-period EMA nears the 200-period EMA, increasing the death cross chances.” Link
All interpretations are limited to the data provided in the snapshot and the cited external commentary.