LTC-USD Weekly Technical Analysis: Price Holds Above 20/50-Day Averages, RSI at 65, MACD Positive Momentum
Executive Summary
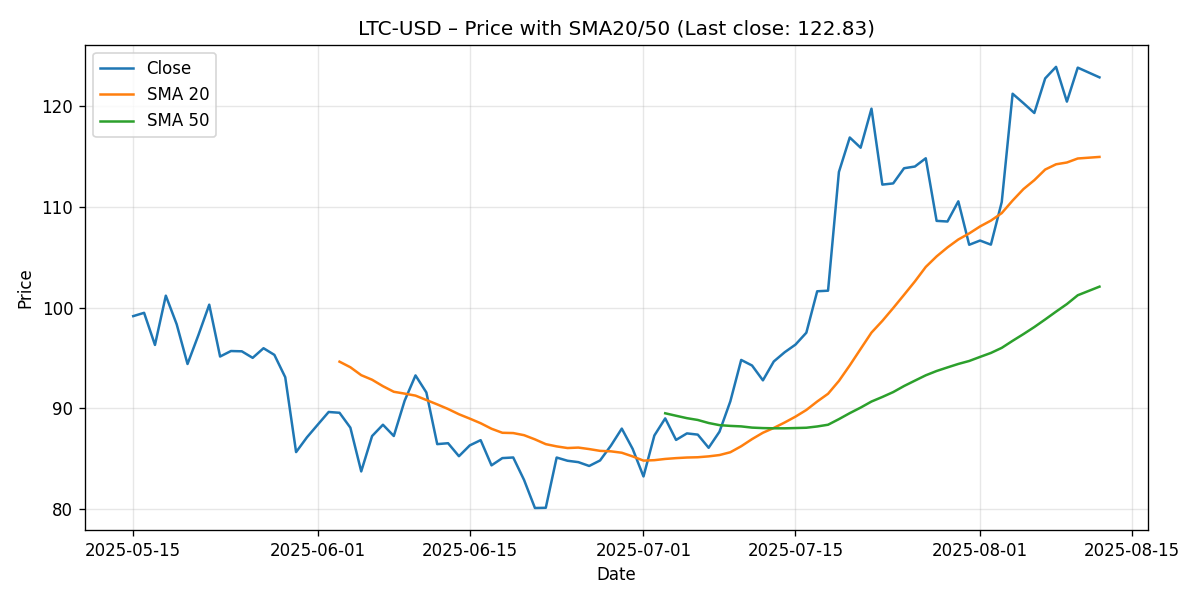
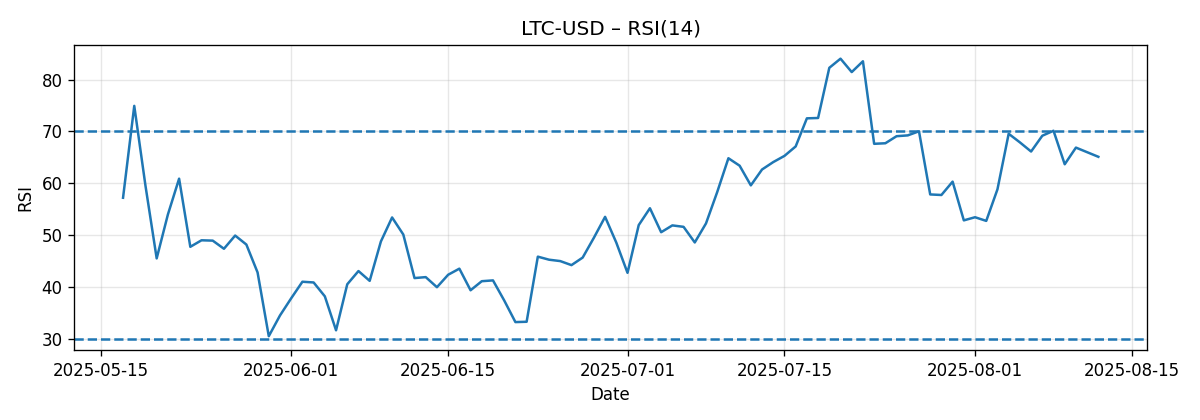
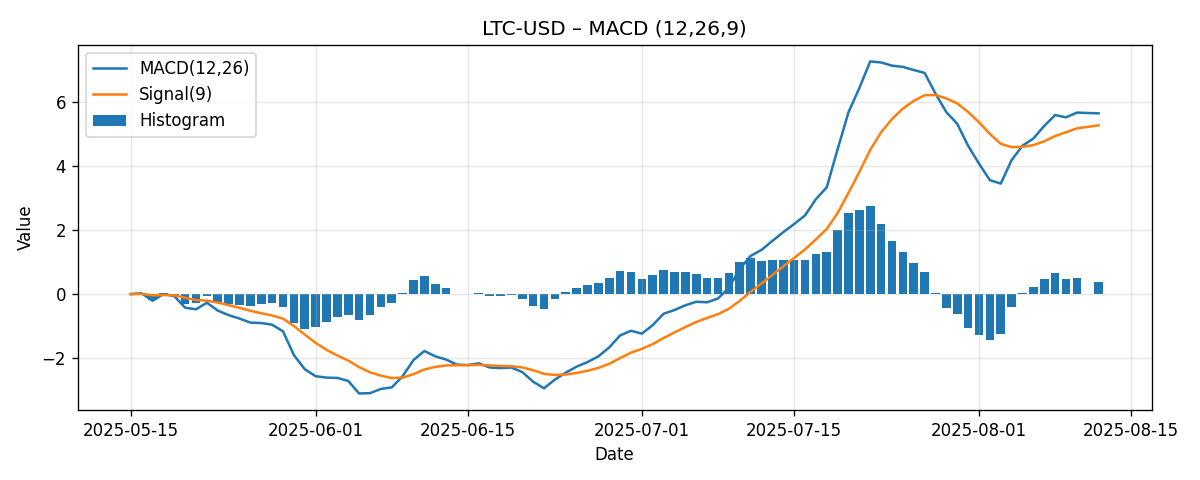
Litecoin (LTC-USD) closed the latest seven-day window at 122.83, posting a modest weekly gain of approximately 2.13%. The technical setup is constructive at the time of this analysis (generated at 2025-08-12), with price trading above both its 20-day and 50-day simple moving averages (SMA20 ≈ 114.94; SMA50 ≈ 102.07). Momentum indicators corroborate the positive tone: the 14-day Relative Strength Index (RSI14) prints 65.11—firmly bullish yet not overbought—and the MACD (12/26/9) sits above its signal line (MACD 5.65 vs. Signal 5.27), leaving a positive histogram of roughly +0.37.
From a trend standpoint, LTC’s alignment of short- and medium-term levels supports a buy-the-dip bias. Price is: (a) ~6.9% above the 20-day average and (b) ~20.3% above the 50-day average. These cushions provide a clear roadmap for pullback risk management while also framing likely resistance zones around nearby round numbers (e.g., 125 and 130). The setup is not without risks, however: RSI sits in the upper neutral band, where momentum can either extend into overbought or reverse, and any failure to hold the 20-day could invite a deeper retest toward the 50-day.
External technical summaries presently skew constructive and generally align with our read. Investing.com’s LTC/USD technical dashboard highlights a “Strong Buy” bias across both moving averages and indicators. CoinDesk has noted the potential for a “golden cross” to precede a multi-week rally—while we cannot verify longer-dated moving averages from the snapshot, our short/medium-term alignment is already bullish. Barchart’s oscillator snapshot shows a slightly higher RSI reading (68.17%) and a robust 20-day Stochastics %K (83.95%), consistent with an asset leaning positively but flirting with overbought territory on certain measures.
Bottom line for the week ahead: the path of least resistance remains higher while price is above 115 (SMA20), with a reasonable bullish test into 125–130. A daily close back below 115 would dent momentum and refocus the market toward 110–105, with 102 (SMA50) as the stronger downside anchor.
Weekly Market Context & Trend
LTC advanced roughly 2.13% over the past seven days, a measured gain that continues the coin’s constructive slope without overheating. In a market that often oscillates briskly, such an incremental rise is typically healthy, as it allows trend structures (moving averages and oscillators) to reset and build energy. The current configuration can be summarized as follows:
- Trend bias: bullish, with price above SMA20 and SMA50
- Momentum: positive, per RSI 65.11 and MACD above signal
- Risk posture: balanced, given proximity to upper-neutral RSI and nearby psychological resistances
The fact that the 20-day average (≈114.94) is itself above the 50-day (≈102.07) confirms a short-over-medium trend alignment. While not the classic 50/200-day “golden cross,” this layering is the standard look for an asset climbing the right side of an intermediate trend. The weekly gain, though modest, aligns with this posture: a steady push higher, not a blow-off.
On the chart, traders will likely anchor their bias around three tiers:
- Tier 1 (immediate/pivot): 120–125, the zone around the recent close
- Tier 2 (nearby support): 115 (SMA20) with 118–119 as an initial buffer on shallow dips
- Tier 3 (deeper support): 110–105 with the SMA50 (≈102) as the structural guardrail
In the near term, clearing and holding above the 125 handle would shift focus to the next round-number magnet at 130. Failure to maintain above 120 could open a slip toward the 118–115 belt, where follow-through behavior will be more telling than the initial reaction.
Detailed Technicals (Price + SMA20/50, RSI14, MACD 12/26/9)
Price vs. SMA20 and SMA50
Last close: 122.83. The market sits about 6.87% above its SMA20 and about 20.35% above its SMA50. This dual-layer cushion typically signals a healthy uptrend phase, where the 20-day acts as the first line of support and the 50-day provides the more consequential trend boundary. Practically:
- Holding above ~115 (SMA20) keeps immediate momentum intact.
- Closing below ~115 raises the probability of a fuller mean reversion into the 110–105 area.
- The SMA50 at ~102 is the line in the sand for intermediate trend integrity.
Because price is sufficiently stretched above the SMA50, any pullback toward 110–105 would not, by itself, destroy the broader uptrend. It would, however, test the market’s appetite to defend momentum after a multi-week climb.
RSI14: Momentum Firm, Not Overbought
RSI14: 65.11. The upper-neutral/lower-overbought zone (60–70) is a transition band where trends often either:
- Accelerate into overbought (RSI > 70), confirming a momentum breakout, or
- Stall and mean-revert to the 45–55 band as price consolidates.
With RSI at 65, LTC has room to extend without requiring an immediate reset. If the indicator pushes through 70 on strong breadth, the next leg up could be brisk as shorts cover into strength. Conversely, a dip back under ~60 on a daily basis would signal a momentum pause, favoring consolidation toward the SMA20.
MACD (12/26/9): Positive Crossover Maintained
MACD: 5.65; Signal: 5.27; Histogram: +0.37. The MACD line remains above its signal line, indicating the bullish impulse is intact. A shrinking histogram would caution that momentum is fading, while an expanding histogram would validate renewed upside thrust. At present, the positive spread—though not large—supports a constructive bias.
Traders often watch for a fresh expansion in the histogram after a shallow consolidation as a timing tool for continuation entries. Conversely, a bear cross (MACD falling below its signal) would typically precede or accompany a breakdown through the 20-day average.
Key Levels (Support/Resistance)
The table below consolidates actionable levels derived from the provided snapshot, emphasizing moving averages and psychologically important round numbers. Strength ratings are qualitative, based on typical market behavior around these references.
| Level | Type | Rationale | Strength |
|---|---|---|---|
| 130.00 | Resistance | Round-number magnet above market; typical profit-taking zone after a near-term run | Moderate |
| 125.00 | Resistance | Nearby round number just above last close; initial upside checkpoint | Moderate |
| 122.83 | Pivot | Most recent close; near-term sentiment marker for intraday flows | Moderate |
| 120.00 | Support/Resistance | Psychological round number around recent price; can flip roles depending on tape | Moderate |
| 114.94 | Support | 20-day SMA; first dynamic support within the prevailing uptrend | Strong (near-term) |
| 110.00 | Support | Intermediate round number between SMA20 and SMA50; common mean-reversion waypoint | Moderate |
| 105.00 | Support | Secondary round-number shelf above SMA50; potential downside objective on deeper dips | Moderate |
| 102.07 | Support | 50-day SMA; primary intermediate trend line in this snapshot | Strong (intermediate) |
| 100.00 | Support | Major psychological level; often attracts responsive buyers in crypto markets | Strong (psychological) |
Scenario Analysis: Next-Week Price Projections
These scenarios are framed by the current technical posture and the levels defined above. Ranges are approximate and reflect where price could trade within the next week under the respective conditions. They are not guarantees and are intended for planning and risk-management purposes only.
Bullish Scenario (probability: moderate while above SMA20)
- Trigger/Confirmation: Sustained trade above 120 with a daily close pushing through 125; RSI holds 60–70, and MACD histogram stabilizes or expands.
- Projected range: 124.50 to 130.00.
- Upside markers: Intraday acceptance above 125 shifts attention to 127.50–130, where round-number resistance and potential profit-taking emerge.
- Risk management: A failure back below 120 after testing 125 would warn of a bull trap; consider tightening stops or scaling risk accordingly.
Bearish Scenario (probability: low-to-moderate while MACD remains positive)
- Trigger/Confirmation: Daily close below 118 followed by a failure at 120 on retest; RSI slips below 60 and MACD histogram compresses toward zero.
- Projected range: 112.00 to 118.50.
- Downside markers: The 115 area (SMA20) is the first objective; a decisive break could extend toward 110–108, with dip buyers likely to show ahead of the SMA50.
- Risk management: If momentum accelerates, allow for an overshoot into 105–103; the SMA50 (~102) is the final near-term line before the intermediate trend thesis is materially challenged.
Most-Likely Scenario (probability: moderate)
- Backdrop: Consolidation with an upward bias as the market digests gains and respects SMA20 support.
- Projected range: 118.00 to 128.00.
- Tape behavior: Choppy sessions around 120–125, with shallow dips bought near 118–119 and sellers capping rallies near 127–128 absent a catalyst.
- Watch for resolution: A clean break of either 118 or 125 is likely to define the subsequent directional swing into one of the alternative scenarios.
Comparative Outlook: How Our View Stacks Up vs External Calls
We anchor our analysis strictly on the provided snapshot and the following external technical commentaries. Here’s how they compare with our read and why:
1) Investing.com LTC/USD Technicals
Source: Investing.com — LTC/USD Technical Analysis
“Summary: Strong Buy; Moving Averages: Strong Buy; Technical Indicators: Strong Buy.”
Alignment: Broadly aligned. Our snapshot shows price above the SMA20 and SMA50 with bullish momentum (RSI 65.11; MACD line above signal), which coheres with a “Strong Buy” technical status. We nuance this stance by emphasizing the importance of the SMA20 (~115) as the immediate control level; should price close below it, we would downgrade the near-term outlook from “strongly bullish” to “neutral-bullish” pending evidence of dip demand above the SMA50.
2) CoinDesk: Potential “Golden Cross” Setup
Source: CoinDesk — Litecoin Slides as ETF Optimism Battles Wider Market Slowdown
“Technical analysis suggests a potential ‘golden cross’ pattern, which could precede a multi-week rally.”
Alignment: Directionally supportive but not fully verifiable from our data alone. A “golden cross” typically refers to the 50-day SMA crossing above the 200-day SMA. Our snapshot includes the 20-day and 50-day averages only, both of which are stacked bullishly (SMA20 > SMA50, and price > both). While this short/medium alignment is consistent with a market that might also be on track for longer-term improvements, we cannot confirm the 200-day relationship from the provided figures. Our takeaway: near-term structure already leans bullish; a longer-term golden cross, if it materializes, would add durability to the trend, but it is not necessary for the next week’s outlook.
3) Barchart Oscillator Read
Source: Barchart — Litecoin – USD Technical Analysis
“14-Day Relative Strength 68.17%; 20-Day Stochastics %K 83.95%.”
Alignment: Largely consistent with our momentum assessment, with minor variance due to data timing and calculation inputs. We observe RSI14 at 65.11 in the snapshot; Barchart’s 68.17% indicates slightly stronger momentum. Both point to a market leaning bullish, with stochastic readings in the 80s often associated with persistent uptrends or short-term overbought conditions. Practically, this means upside continuation remains feasible, but the risk of shallow pullbacks increases as momentum climbs.
Netting these views: The consensus among external technical dashboards leans bullish. Our perspective aligns, with two caveats: (1) we anchor risk to 115 (SMA20) for the immediate timeframe, and (2) we acknowledge the possibility of consolidation beneath 130 as momentum oscillators approach or breach overbought territory. This positioning allows participation in upside while respecting nearby invalidation points.
Risk Factors & What Could Invalidate The Setups
Even robust trends can fail. The following factors could undermine the constructive LTC-USD setup described above:
- Breakdown through SMA20 (~115): A decisive daily close under the 20-day average would challenge the short-term uptrend and likely transition price into a 118–110 value exploration. This would also risk a momentum rollover in RSI and a narrowing MACD spread.
- Momentum deterioration: An RSI slip back into the 50–55 zone coupled with a MACD bear cross (MACD falling below its signal) would indicate buying pressure is fading. This combination increases the probability of a test toward 110–105.
- Failed breakout and bull trap near 125–130: Pushing above 125 and failing to hold could spark a fast rejection, especially if broader crypto risk sentiment turns cautious. Such failed moves can accelerate toward the nearest moving average.
- Volatility shock: As with all crypto assets, exogenous catalysts can induce outsized moves. Rapid volatility expansions tend to overshoot technical levels before mean reversion, temporarily degrading the reliability of nearby supports/resistances.
- Divergences: If price makes a marginal higher high while RSI or MACD fail to confirm, that non-confirmation often precedes a consolidation phase or a pullback toward the nearest dynamic support.
Invalidation thresholds to monitor in the coming week:
- Short-term bullish invalidation: Daily close below 115 with follow-through selling on retest attempts.
- Intermediate-trend caution: A sustained move into 105–102 area would argue for a reassessment of the broader bullish structure.
- Upside invalidation (for bears): A firm close above 125 that holds on retests and drives RSI above 70 would weaken bearish counterarguments and favor a push toward 130.
Editorial Statement (Disclaimer)
This report is an educational technical analysis based solely on the data snapshot provided (price, SMA20/50, RSI14, MACD 12/26/9, and weekly change) and the explicitly cited third-party technical commentaries from Investing.com, CoinDesk, and Barchart. It does not incorporate undisclosed fundamental events, on-chain metrics, or additional price history beyond what is presented above. Markets are uncertain and can deviate materially from any scenario described.
Nothing herein is financial, investment, or trading advice. The projections and levels are illustrative frameworks intended to support disciplined planning and risk management. Always conduct your own research, consider your risk tolerance, and, if appropriate, consult a qualified financial professional. Past performance and technical patterns do not guarantee future results.
Appendix: Methodological Notes
- All indicator values (price: 122.83; SMA20: 114.94; SMA50: 102.07; RSI14: 65.11; MACD: 5.65; MACD signal: 5.27) are taken directly from the provided snapshot generated on 2025-08-12.
- Interpretations of RSI and MACD follow common market conventions: RSI > 70 often considered overbought; RSI < 30 oversold; MACD above signal implies bullish momentum, and vice versa.
- Support/resistance levels include dynamic references (moving averages) and psychological round numbers, which are widely used in technical practice for context and trade planning.
- External outlooks have been cited verbatim in brief and linked for reference: Investing.com (technical dashboard), CoinDesk (discussion of a potential golden cross context), and Barchart (oscillator readings). Our commentary explains alignment or differences relative to the snapshot.
In summary, LTC-USD currently exhibits a favorable technical posture: price is riding above key moving averages, momentum is positive without being extended, and external technical views are generally supportive. The immediate battleground is 120–125; holding above 115 sustains the bias toward 125–130 in the week ahead, while a break back into 118–115 would argue for patience and tighter risk controls until buyers reassert control.