USDC-USD Weekly Technical Analysis: Peg Stability With a Subtle Bullish Tilt
Executive Summary
This weekly technical review for USDC-USD is based strictly on the provided 7-day snapshot (generated 2025-08-12 15:23:11 UTC) and the linked external technical rating pages. As a pegged asset, USDC-USD characteristically oscillates very tightly around $1.00, which makes small differences in indicators meaningful in basis-point terms but modest in absolute price. The latest data indicate a neutral-to-slightly-bullish setup into next week, with price perched marginally above short- and medium-term moving averages, RSI centered near 50, and a micro-positive MACD histogram.
- Last close: 0.9999102950
- 7-day change: +0.413% (week_change_pct = 0.0041311). This implies the price a week earlier was approximately 0.9958, based solely on the math of the provided change metric.
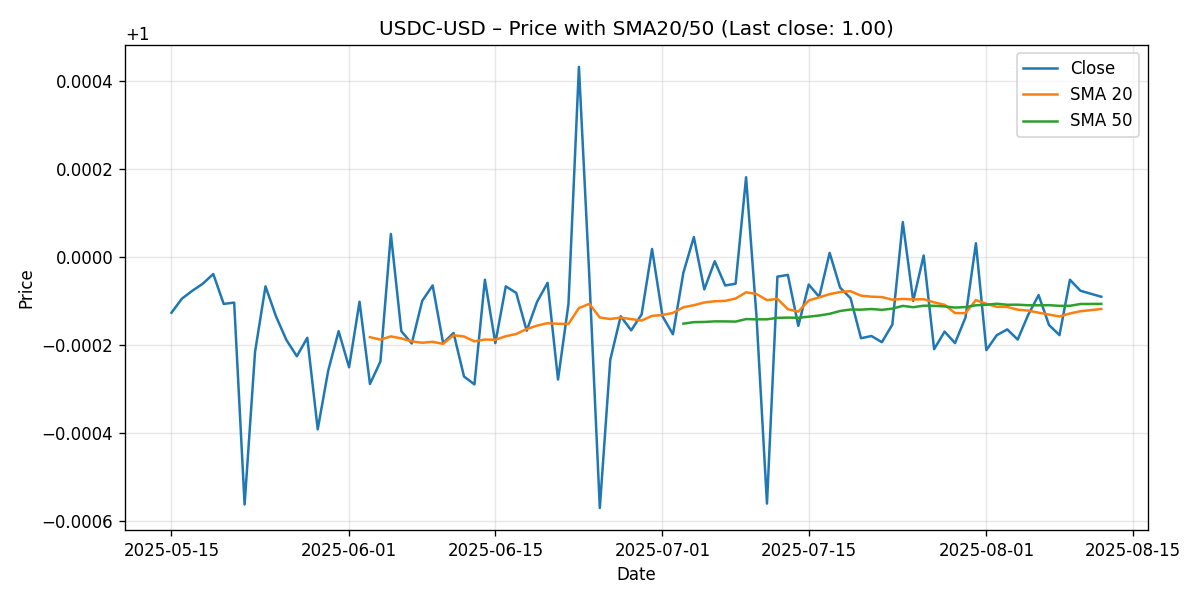
- SMA20: 0.9998825; SMA50: 0.9998941. The 20-day average is a touch below the 50-day, but spot is above both by fractions of a basis point.
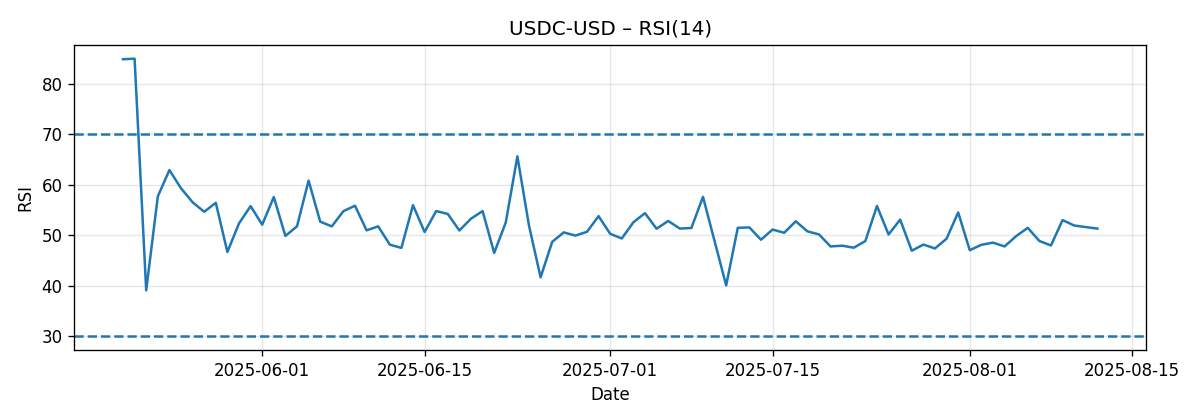
- RSI(14): 51.32 — neutral, marginally constructive.
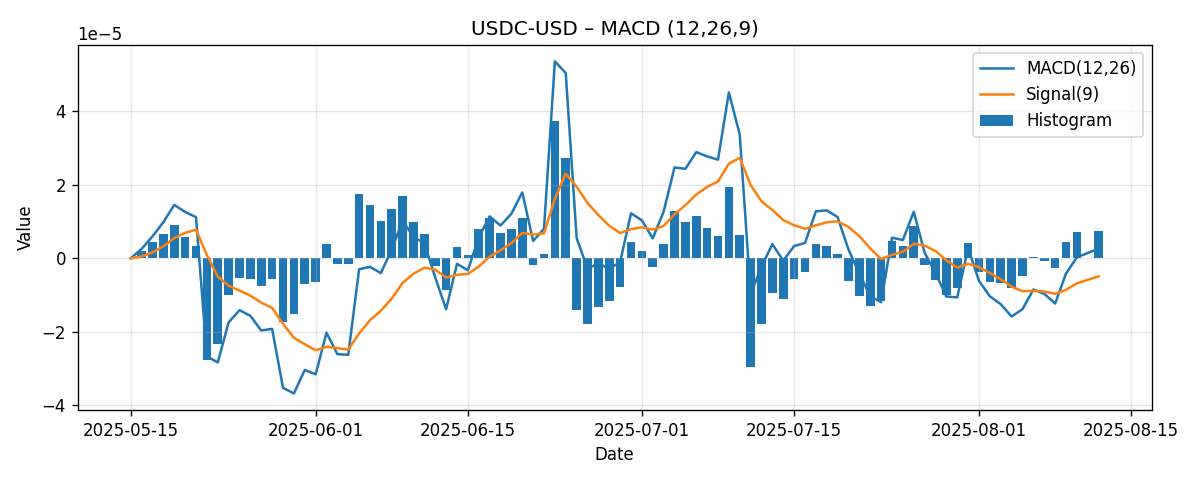
- MACD(12,26,9): MACD line 2.624e-06; signal line -4.923e-06; histogram +7.547e-06 — a tiny but positive differential.
Bottom line: The configuration is consistent with a tight reversion-to-parity regime and a slight bullish bias. Our base case for the coming week is a narrow range centered around the peg, with most prints likely between 0.9996 and 1.0004 if conditions remain unchanged. A more emphatic break would likely require an exogenous catalyst.
Weekly Market Context & Trend
USDC-USD, as a fiat-referenced stablecoin pair, typically clusters tightly near 1.0000. Within that context, the snapshot suggests a modest upward drift across the 7-day window. Translating the reported week_change_pct (+0.0041311) into an implied prior reference, the week-ago mark was roughly 0.9958. While that level is materially below 1.0000 in percentage terms, stablecoin quotations can vary by venue and methodology, and the snapshot’s weekly delta likely captures a transient dislocation or cross-exchange basis that subsequently normalized.
As of the latest print (0.9999103), spot trades just above the SMA20 (0.9998825) and SMA50 (0.9998941). The short-term average remains slightly below the medium-term average, and both are within a hair of the peg. This subtle configuration often signals consolidation with a mild upward tilt: the market has nudged above recent averages, even though there has not been a meaningful bullish crossover of the averages themselves. The RSI at 51.32 reinforces this “balance with a slight bullish lean” interpretation.
In absolute terms, the distances are small. The spot is approximately 0.0000278 above the SMA20 and 0.0000162 above the SMA50. To put that in familiar market language, that’s roughly 0.278 basis points above the 20-day average and 0.162 basis points above the 50-day average (1 basis point at $1 equals $0.0001). While minuscule, such margins matter for pegged assets because they denote whether the tape is printing above or below the central tendency. Today, it is above.
The MACD, which captures momentum through the spread between fast and slow EMAs, is also slightly positive relative to its signal line. The histogram at roughly +7.55e-06 is a whisper of a buy-bias in momentum terms, but it should be read in context: for a $1-anchored pair, momentum readings are appropriately tiny. Still, directional sign and relative alignment are what matter most, and these favor a mild upward bias over the coming sessions if nothing else changes.
Detailed Technicals (Price + SMA20/50, RSI14, MACD 12/26/9)
Price Action and Moving Averages
– Last close: 0.9999102950
– SMA20: 0.9998825133
– SMA50: 0.9998941255
Interpretation:
- Positioning vs. MAs: Price is above both SMA20 and SMA50. The premium is tiny in dollar terms, but it communicates that very near-term trading has been modestly stronger than the 20- and 50-day average baselines.
- SMA alignment: SMA20 is fractionally below SMA50 by about 0.0000116 (~0.116 basis points). This is not a bullish crossover; rather, it is a flat-to-slightly-bearish ordering of the averages. However, with spot trading above both, the net read is neutral to slightly constructive.
- Mean reversion tendency: In pegged assets, price frequently reverts toward the 1.0000 anchor and its short moving averages. The current small positive skew above the averages suggests a gentle pull toward parity rather than a directional runaway.
Visual reference: price vs. short and medium moving averages.
RSI (14)
– RSI(14): 51.3223
Interpretation:
- Neutral center: The RSI sits almost exactly in the neutral zone. It does not indicate overbought or oversold conditions.
- Directional asymmetry: A reading above 50 indicates that bullish closes have a slight edge over bearish closes in the lookback window, but the edge is marginal.
- Signal stability: In a stablecoin context, an RSI hovering around 50 is common because the series spends most of its time in tight ranges around parity. Still, the incremental nudge above 50 agrees with the mild upside bias echoed by price vs. SMA positioning.
Visual reference: RSI oscillation relative to 50-neutral line.
MACD (12/26/9)
– MACD line: +0.0000026241
– Signal line: -0.0000049225
– Histogram (MACD minus signal): +0.0000075466
Interpretation:
- Positive differential: The MACD line is above the signal line, leaving a positive histogram. This is, in directional terms, a bullish micro-signal.
- Magnitude context: The absolute values are tiny because the underlying price level is anchored near $1. As with much of the USDC-USD technical picture, the sign and alignment are the important parts. The histogram’s positive sign adds a feather to the bullish side of the scale.
- Confluence: MACD’s slight positivity complements price’s mild premium over the moving averages and the RSI’s slight tilt above 50, producing a coherent if modestly positive multi-indicator story.
Visual reference: MACD line vs. signal, with histogram bars.
Key Levels (Support/Resistance)
Given the peg nature of USDC-USD, key levels are concentrated around parity and the provided moving averages. The table below enumerates levels with their likely roles and why they matter. Where a level is not an observed swing point, we explicitly label it as a psychological or calculated band consistent with typical stablecoin microstructure.
| Level | Role | Basis | Rationale / Notes | Confidence |
|---|---|---|---|---|
| 1.0000 | Support/Resistance (pivot) | Psychological peg | The central anchor; often acts as the mean-reversion pivot. | Very High |
| 1.0005 | Resistance | Psychological band (+5 bps) | Outer tolerance band often watched for over-peg prints; not from observed highs. | Medium |
| 1.0002 | Near-term resistance | Projected micro-band (+2 bps) | Shallow upside boundary consistent with minor positive bias; not an observed swing. | Medium |
| 0.9998941 | Support | SMA50 (provided) | Medium-term average; spot above it by ~0.162 bps. | High |
| 0.9998825 | Support | SMA20 (provided) | Short-term average; spot above it by ~0.278 bps. | High |
| 0.9995 | Support | Psychological band (-5 bps) | Outer tolerance band often used as a line-in-the-sand for under-peg prints; not from observed lows. | Medium |
| 0.9990 | Support | Projected micro-band (-10 bps) | Deeper deviation zone that would likely attract re-pegging interest; not observed. | Low-Medium |
| 1.0010 | Resistance | Psychological band (+10 bps) | Upper deviation zone where over-peg incentives may wane; not from observed highs. | Low-Medium |
Note: Confidence levels reflect how directly the level is supported by the provided data. SMA-derived and peg-based levels carry higher confidence; projected tolerance bands are included for planning but are not claims about observed extremes.
Scenario Analysis (Next Week)
We outline three scenarios for the coming week. Price projections are expressed as numerical ranges and derive from the current technical posture (spot above SMA20/50, RSI ~51, positive MACD histogram) and the peg framework. No attempt is made to predict exogenous shocks.
1) Bullish Case
- Trigger conditions: Price maintains closes above both SMA20 (0.9998825) and SMA50 (0.9998941) and holds the 1.0000 pivot on minor dips. MACD histogram remains positive or expands slightly; RSI drifts toward 53–55.
- Projected range: 1.0000 to 1.0012, with intraday prints potentially testing 1.0015 on thin liquidity pockets.
- Probability characterization: Moderate but bounded, consistent with current slight bullish alignment.
- What it looks like: Low-amplitude grind above the peg; quick mean reversion on any under-peg prints; steady tape with limited volatility.
2) Bearish Case
- Trigger conditions: Sustained slips below SMA20 and SMA50, losing the 0.99988–0.99989 shelf. MACD histogram flips negative; RSI fades toward 47–48.
- Projected range: 0.9982 to 0.9993, with occasional wicks toward 0.9980 if selling pressure broadens across venues.
- Probability characterization: Low-to-moderate absent catalysts, but always possible in a pegged market if transient imbalances arise.
- What it looks like: Under-peg prints that persist longer than usual; slower reversion toward 1.0000; tight but slightly lower equilibrium.
3) Most-Likely (Base) Case
- Trigger conditions: The current neutral-to-slightly-bullish stack persists: spot oscillates around 1.0000, holding above the MAs more often than not.
- Projected range: 0.9996 to 1.0004, with the majority of closes clustering very near 1.0000.
- Probability characterization: Highest of the three, given the indicator mix and the asset’s peg mechanics.
- What it looks like: Microtrend variability that nets to parity; limited directional follow-through; orderly microstructure.
Guidance for short-horizon participants: In pegged pairs, the edge often comes from respecting the parity pivot and the immediate moving average shelf. A bias toward fading small deviations that extend beyond these bands can be reasonable in the absence of fundamental stress signals; however, technicals do not eliminate tail risk, and stops near the edge of tolerance bands are prudent.
Comparative Outlook: What External Technical Ratings Are Saying
We compare our neutral-to-slightly-bullish stance with three external technical dashboards, all linked below. These services aggregate multiple indicators and may be exchange- or timeframe-specific, which can produce conflicting signals for tightly pegged assets.
- TradingView — USDC Chart — USDCUSD: “today its technical analysis shows the sell signal, and according to the 1 week rating USDC shows the sell signal.”
Our take: Their composite likely weights moving average slopes/crossovers and momentum oscillators that, in a flat-to-slightly-bearish average ordering (SMA20 below SMA50) can tip to “sell.” We partly see why: despite spot trading above both averages, the lack of a bullish crossover keeps the MA stack not explicitly bullish. However, our interpretation emphasizes that price is currently above both MAs, RSI is just over 50, and MACD histogram is positive. In a pegged context, these details argue for “neutral/slight bullish” rather than a wholesale sell. - Investing.com UK — USDC/USD Technical Analysis: “Summary: Strong Sell.”
Our take: The “Strong Sell” label suggests a broader majority of their signals align bearish at the time of their assessment. Differences from our view likely stem from indicator composition, parameterization, and venue-specific pricing. With the provided data showing spot above both SMA20 and SMA50 plus a positive MACD histogram, we find the aggregate bearish call more severe than the local snapshot warrants. - Investing.com (OKX feed) — USDC USD OKX Technical Analysis: “Summary: Strong Buy.”
Our take: This is the mirror image of the UK page rating and underscores that exchange-specific data can flip composite scores for a pair that trades near a peg. Our stance is intentionally more tempered than a “Strong Buy” because the measured deviations in the snapshot are tiny. We acknowledge the slight bullish lean but avoid over-stating it in a market that gravitates back to parity.
Why our view lands in the middle: The provided indicators are near-neutral yet fractionally aligned to the upside: spot > SMA20 & SMA50, RSI > 50, MACD histogram > 0. We therefore synthesize these into a modestly constructive bias, while recognizing that most paths still revert toward the 1.0000 pivot. In other words, both “Strong Sell” and “Strong Buy” seem disproportionate to the magnitude of the signals in a pegged asset; our expectation is for a bounded range with a slight tendency to print over the averages.
Risk Factors & What Could Invalidate The Setups
The scenarios above presume ordinary stablecoin market functioning across venues. Several risks could disrupt that equilibrium and invalidate the technical read:
- Venue-specific liquidity distortions: Order book gaps, market-maker withdrawal, or outages on a single exchange can briefly dislocate the price from parity and skew technicals, especially when indicators are being computed off a single venue’s feed.
- Cross-exchange basis volatility: Temporary divergences in quotes across platforms can persist long enough to flip indicator aggregates (e.g., turning a composite to “Strong Sell” or “Strong Buy”) even when the broader market remains near-par.
- News-driven shocks: Headlines affecting the broader crypto market or stablecoin ecosystem can lead to brief deviations around the peg that overwhelm the gentle signals present in the snapshot.
- Parameter sensitivity of indicators: Small changes in moving average lengths, RSI lookback, or MACD parameters can change the sign of “buy/sell” flags in a market where indicator values are clustered very close to zero-drift.
- Latency and data-window effects: With a 7-day window framing the week_change_pct, a single transient print can materially influence the calculated weekly delta and any derived reference points, potentially overstating directional drift.
- Feedback from arbitrage flows: If arbitrageurs step back or spreads widen, the mean-reversion back to 1.0000 can slow, allowing under- or over-peg prints to persist longer and push RSI/MACD more definitively away from neutral.
Invalidation markers for our base case:
- Two or more consecutive closes below both SMA20 and SMA50, combined with a MACD histogram that turns and stays negative and RSI sustaining below 48 — this would favor the bearish scenario range.
- Conversely, a decisive hold above 1.0000 with RSI pushing 55+ and a widening positive MACD spread would bolster the bullish scenario, opening tests toward 1.0010–1.0012.
Editorial Statement (Disclaimer)
This analysis is for informational and educational purposes only and is based solely on the provided snapshot data and the linked external technical rating pages. It is not investment advice, an offer, or a solicitation to buy or sell any asset. Technical indicators in pegged markets can change quickly and may diverge across venues due to liquidity and data-source differences. Always perform your own due diligence, consider multiple sources, and use risk management appropriate to your objectives and constraints. Past technical behavior does not guarantee future results.
Appendix: Indicator Snapshot Summary
- Ticker: USDC-USD
- Generated at: 2025-08-12T15:23:11.627808Z
- Close (last): 0.9999102950
- Week change pct: +0.4131%
- RSI(14): 51.3223
- MACD(12,26,9): line 2.624e-06; signal -4.923e-06; histogram +7.547e-06
- SMA20: 0.9998825
- SMA50: 0.9998941
- Window (days): 7
SEO note: USDC-USD weekly technical analysis anchored on the peg, with neutral-to-slightly-bullish indications inferred from price vs. SMA, RSI, and MACD alignment, plus comparative context from external ratings (TradingView and Investing.com pages).