Gold Futures (GC=F) Weekly Technical Analysis:
Executive Summary
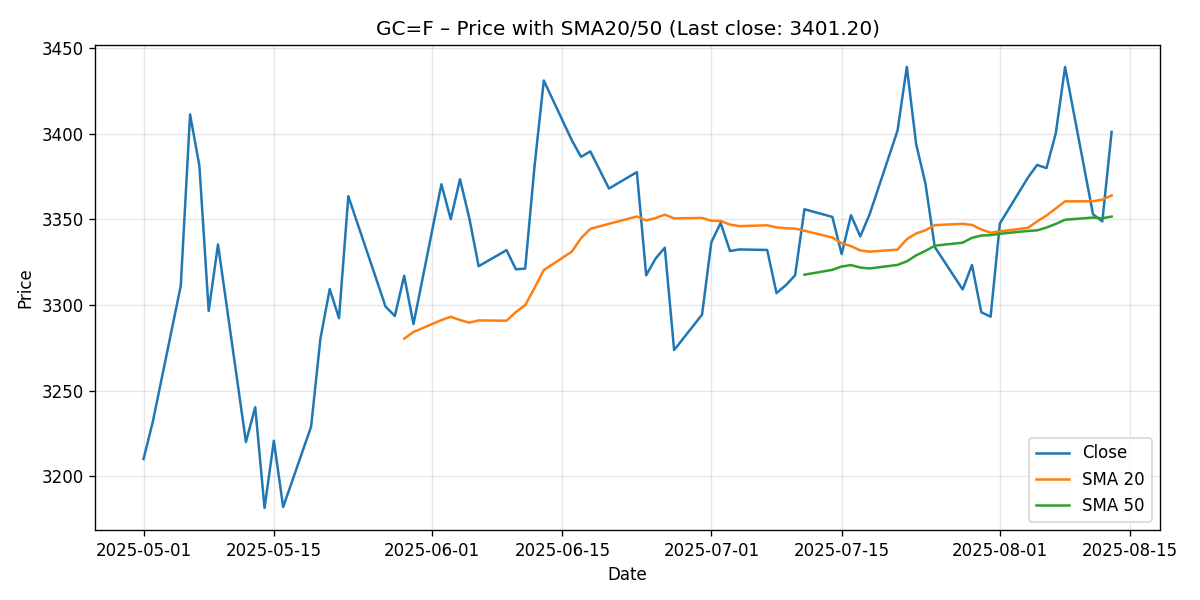
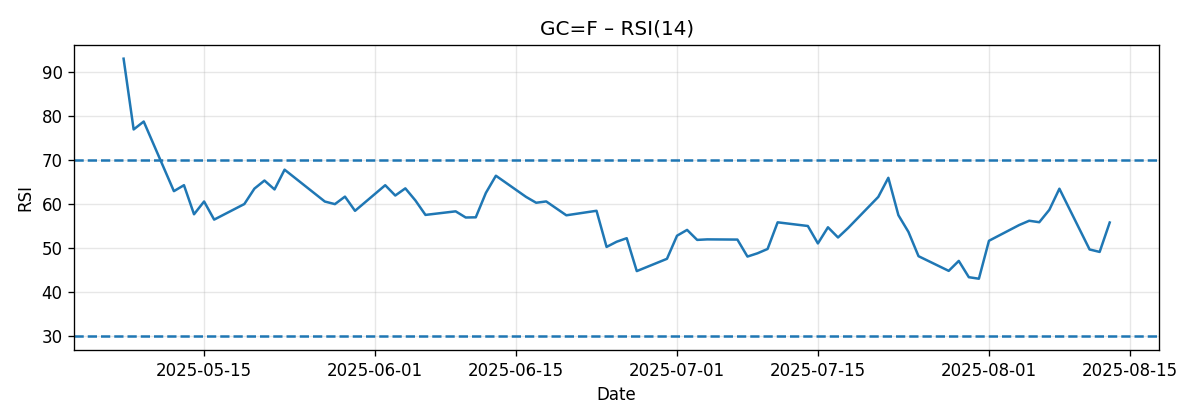
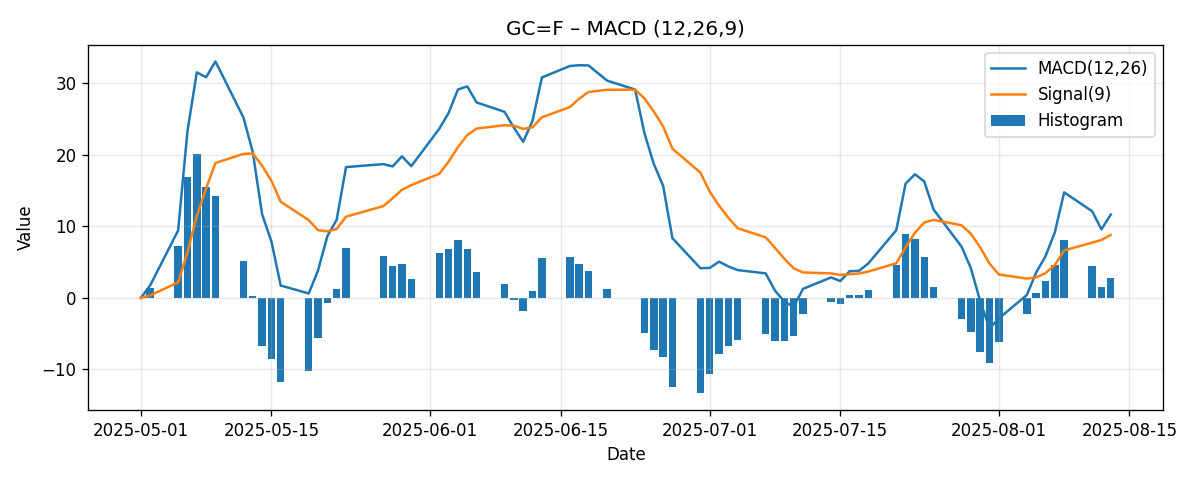
Gold futures (GC=F) finished the week modestly higher, extending a cautious upward bias while remaining sandwiched between layered support and a well-telegraphed resistance band. The technical picture is constructive but not exuberant: price closed at 3,401.20, up approximately 0.57% week over week, with momentum gauges signaling a mild bullish edge without overextension. Specifically, the 14-day RSI registered 55.86, the MACD (12/26/9) remained positive at 11.66 and above its signal line (8.81), and price held above both the 20-day and 50-day simple moving averages (SMA20 at 3,364.07; SMA50 at 3,351.72). Short-term trend alignment is favorable, with the SMA20 exceeding the SMA50 by roughly 12.35 points.
Key external reference levels frame the next tactical moves. According to Reuters, support is visible in the 3,314–3,342 zone. Investopedia flags 3,435 as a breakout level that could open a path toward 3,735, with stronger, deeper support near 3,245. With GC=F roughly 1.0% below 3,435 and 1.8%–2.6% above the Reuters support band, the market appears coiled in a narrowing pocket of opportunity.
- Close (last): 3,401.20 (+0.57% w/w)
- RSI(14): 55.86 (positive tilt, not overbought)
- MACD(12/26/9): 11.66 vs. Signal 8.81 (histogram ≈ +2.85)
- SMA20: 3,364.07; SMA50: 3,351.72 (price above both; SMA20 > SMA50)
- Key reference support: 3,314–3,342 (Reuters)
- Key breakout resistance: 3,435 (Investopedia)
Base case: Range-bound to mildly bullish bias into next week, with a working range of approximately 3,350–3,435 unless a decisive breakout or breakdown unfolds. A sustained push through 3,435 would likely extend toward the low 3,500s in the near term, whereas a failure that forces closes below 3,342/3,314 could drag price toward 3,300–3,245.
Weekly Market Context & Trend
The week delivered a net gain of about 0.57% for GC=F, a modest advance that nonetheless kept price above key short- and intermediate-term reference points. When a market trades above its SMA20 and SMA50 while RSI rests in the mid-50s and MACD remains positive and above its signal, the technical bias typically skews constructive. The posture suggests ongoing accumulation on dips, though immediate upside follow-through still hinges on how price behaves into the nearby resistance cluster centered around 3,435.
Contextualizing the current placement among signposts helps quantify risk and opportunity:
- Distance to SMA20 (3,364.07): roughly +37.13 points (+1.10%).
- Distance to SMA50 (3,351.72): roughly +49.48 points (+1.48%).
- Distance to Reuters support band (3,314–3,342): approximately +59 to +87 points (+1.8% to +2.6%).
- Distance to Investopedia breakout level (3,435): roughly -33.8 points (~-0.99%).
In other words, the market is closer to the upside trigger (3,435) than it is to the deeper supports, with the immediate cushion provided by the SMA20 and SMA50 and the externally cited 3,314–3,342 band below. This geometry often favors the bulls if they can promptly test and clear resistance, but it also sets up a classic inflection: failure at resistance increases the odds of a rotation back into the moving averages and toward the cited support band.
Given the current balance of indicators, the near-term trend looks like a gently rising channel within a broader high-level consolidation. While momentum is supportive, it is not at extremes, leaving room for either a continuation leg higher or a consolidation drift without immediate risk of a momentum-driven reversal. The market’s path into next week will likely be decided by how it behaves in the 3,395–3,435 corridor: consolidation and higher lows sustain the bid; repeated failures and lower highs tilt the balance toward a test of the mid-3,300s.
Detailed Technicals (Price + SMA20/50, RSI14, MACD 12/26/9)
Price Action and Moving Averages
Last close: 3,401.20. The relationship between spot price and key moving averages provides a structural read:
- Price > SMA20 (3,364.07) and Price > SMA50 (3,351.72).
- SMA20 > SMA50 by approximately 12.35 points (~0.37%).
This alignment generally indicates a constructive backdrop in which the shorter-term trend is stronger than the medium-term trend, with both below the current price. Such a configuration can act as a “stair-step” bullish structure, where minor pullbacks into the SMA20 are bought, and deeper pullbacks test SMA50. The cluster of dynamic support near 3,352–3,364 sits immediately above the Reuters-cited 3,314–3,342 static support band, creating a layered support stack that can absorb routine mean reversion.
From a tactical perspective, the market’s proximity to 3,435—a resistance highlighted externally—makes the next push critical. A failure to clear it after multiple attempts often leads to consolidation or a retrace into the moving averages. Conversely, a swift and decisive break, ideally on expanding momentum, would validate the bullish alignment and invite follow-through.
RSI(14): Momentum Without Excess
The 14-day RSI sits at 55.86. This level is comfortably above the neutral 50 threshold while still far from overbought territory (commonly 70), signaling positive momentum with additional room to extend if buying pressure returns. The RSI’s mid-50s zone often corresponds to markets that have pulled back from highs or are consolidating gains while retaining a bullish tilt.
Key tactical implications of the current RSI reading:
- As long as RSI holds above ~50, momentum is more likely to support dips rather than fuel sharp downside breaks.
- A push into the 60–65 range would typically coincide with an upside challenge and potential break of nearby resistance (e.g., 3,435), whereas a drop below ~45 would warn that sellers are gaining traction.
- RSI divergence is not indicated by the snapshot; however, traders should monitor for any bearish divergence if price makes a marginal new high without RSI confirmation.
MACD (12/26/9): Positive and Above Signal
The MACD line is 11.66, the signal line is 8.81, and the implied histogram is approximately +2.85. A positive MACD above its signal typically indicates that short-term momentum exceeds medium-term momentum, aligning with the constructive MA configuration discussed earlier. Additionally, a positive MACD value signifies that the 12-period EMA sits above the 26-period EMA, reinforcing the bullish tone.
Tactical considerations from MACD:
- With the MACD above the signal and above zero, the path of least resistance remains mildly higher, contingent on price action near resistance.
- If the histogram were to compress toward zero (MACD approaching signal) without price progress, it would warn of waning momentum and raise the odds of a range reversal toward the SMA20/SMA50.
- Conversely, a fresh expansion of the histogram coupled with a break of 3,435 would offer confirmation of a momentum-led leg up.
Key Levels (Support/Resistance)
The following table synthesizes dynamic and static reference points drawn from the current snapshot and the cited external analyses. Levels are approximate and should be treated as zones rather than single ticks.
| Level | Type | Source/Derivation | Rationale |
|---|---|---|---|
| 3,401 | Pivot (current) | Last close | Reference anchor for next week; near psychological 3,400 round figure. |
| 3,435 | Resistance | Investopedia | Breakout trigger; a sustained move above suggests upside potential toward higher objectives. |
| 3,364 | Support (dynamic) | SMA20 | First dynamic support; routine pullbacks often test this average in an uptrend. |
| 3,352 | Support (dynamic) | SMA50 | Secondary dynamic support; deeper mean reversion often checks the 50-day average. |
| 3,342 | Support (static) | Reuters | Upper bound of externally cited support zone. |
| 3,314 | Support (static) | Reuters | Lower bound of externally cited support zone; break raises risks of deeper retracement. |
| 3,245 | Major support | Investopedia | Key deeper support; would likely require a regime change to reach next week. |
| 3,735 | Distant resistance/target | Investopedia | Objective flagged upon a confirmed breakout above 3,435; higher-timeframe target. |
Scenario Analysis (Next Week)
Below are three path-dependent scenarios for the next five trading sessions, framed by the current technical setup and the cited external levels.
1) Bullish Breakout Scenario
Trigger: A decisive daily close above 3,435 with confirmation via continued strength the following session. Ideally accompanied by RSI pushing above 60 and a widening positive MACD histogram.
Technical rationale: Price is already above SMA20 and SMA50, with SMA20 above SMA50 and MACD above signal. Clearing 3,435 would convert a well-advertised ceiling into potential support, creating scope for trend extension.
Projected next-week range: 3,435–3,520 (with upside tail risk toward 3,560 if momentum accelerates). Note: While Investopedia highlights a longer-term target near 3,735 following a breakout, next-week realization of that magnitude would require an unusually strong impulse; more incremental stair-stepping is statistically more common.
Invalidation: A quick slip back below 3,435 after the breakout, especially if accompanied by RSI failing to hold above ~55 and MACD histogram compressing, would downgrade the scenario back to range-bound.
2) Bearish Rejection/Mean-Reversion Scenario
Trigger: Repeated failures near 3,420–3,435 followed by a daily close below 3,364 (SMA20). Continuation lower would target the 3,352 (SMA50) area, and potentially the Reuters band at 3,342–3,314.
Technical rationale: A non-confirmed push into resistance with fading momentum often drives a mean-reversion leg into the moving averages. A decisive breach beneath the SMA20–SMA50 layer would expose the cited 3,314–3,342 static supports.
Projected next-week range: 3,314–3,350. If 3,314 breaks on a daily close, the range could extend toward 3,280–3,300, with a lower-probability tail toward 3,245 if selling intensifies.
Invalidation: A swift recovery above 3,400–3,410 and a renewed assault on 3,435 with strengthening RSI/MACD would neutralize the downside setup.
3) Most-Likely: Contained Range Scenario
Trigger/Structure: Sideways trade bounded by 3,350–3,435 as the market consolidates gains, respecting the SMA20/SMA50 band while respecting overhead resistance. This scenario aligns with the modest week-over-week gain, mid-50s RSI, and a positive but not surging MACD.
Technical rationale: The current indicator mix favors a modestly bullish range rather than a trend acceleration. The proximity to the externally cited breakout level and layered supports below argues for two-way trade while participants await a catalyst.
Projected next-week range: 3,350–3,435, with intraday excursions possible into 3,342 on dips and up to 3,445 on fleeting probes above resistance that fail to stick.
Invalidation: A daily close outside the 3,342–3,435 envelope, ideally with momentum confirmation (RSI < 45 for downside or > 60 for upside), would shift odds toward the bearish or bullish scenarios, respectively.
Comparative Outlook: External Predictions vs. Our View
We benchmark our assessment against three external references to triangulate the near-term map.
Reuters (Aug 11, 2025): Support 3,314–3,342
Quote: “Technical analysis suggests spot gold could fall further to support around $3,314–$3,342.” Source: Reuters.
Alignment: We incorporate this range as a key static support area. With the last close at 3,401, gold sits roughly 1.8%–2.6% above this zone. Our bearish scenario explicitly targets this band if momentum fades and price loses the SMA20/SMA50 cluster.
Difference: Reuters frames it as a potential destination for further downside. Our base case envisions a contained range with only conditional probability of testing the band next week, given the currently supportive momentum profile. Still, as a magnet for mean reversion, 3,314–3,342 remains pivotal to the short-term map.
Investopedia: Breakout Above 3,435; Key Support 3,245
Quote: “Breakout above $3,435 targets $3,735; key support near $3,245.” Source: Investopedia.
Alignment: Our bullish scenario hinges on precisely this breakout level (3,435). We acknowledge 3,735 as a higher-timeframe objective, while tempering next-week expectations to a stepwise extension toward the low 3,500s. On the downside, we agree that 3,245 is a meaningful deeper support, though getting there in a single week would likely require a decisive regime shift.
Difference: We frame 3,735 as a subsequent objective post-breakout rather than an imminent next-week target. Our focus is on the near-term mechanics: first break and hold above 3,435, then evaluate momentum breadth before extrapolating to the higher objective.
World Gold Council (Goldhub) Mid-Year Outlook 2025: Sideways with Modest Upside
Quote: “Gold may move sideways with possible upside of 0%–5% in H2.” Source: Goldhub.
Alignment: Our most-likely scenario is a contained range. The mid-50s RSI and positive-but-modest MACD support a slow-grind or sideways narrative rather than a runaway trend. The proximity to a major resistance (3,435) and layered support below also argues for bounded price action pending a catalyst.
Difference: While Goldhub’s framing spans the entire second half of the year, our focus is the next week. We translate the broader “sideways with modest upside” theme into a tactical range of ~3,350–3,435 barring a clean technical trigger.
Risk Factors & What Could Invalidate The Setups
Even well-constructed technical setups can be derailed by market dynamics. The following risks and invalidation cues should be monitored closely:
Macro and Market Structure Risks
- Policy and data surprises: Central bank communications, inflation prints, or growth data can abruptly shift rate expectations and risk appetite, impacting gold’s opportunity cost narrative.
- Currency and yield swings: Sharp moves in the dollar or real yields often exert outsized influence on gold; a sudden pivot could overpower the current technical structure.
- Event risk/geopolitics: Headline shocks can cause gap risk or momentum surges in either direction, invalidating nearby levels with little warning.
- Liquidity and positioning: Thin liquidity conditions or crowded positioning can amplify moves beyond what the chart structure suggests.
Technical Invalidation Signals
- Downside invalidation: A daily close below 3,364 (SMA20) followed by a loss of 3,352 (SMA50) would weaken the constructive alignment. A further close below 3,342 and especially 3,314 would shift control toward sellers and open 3,300–3,245.
- Upside invalidation (for bearish setups): A strong breakout and hold above 3,435, particularly if accompanied by RSI > 60 and an expanding positive MACD histogram, would invalidate near-term bearish mean-reversion calls.
- Momentum tells: RSI slipping under ~45 and MACD crossing below its signal would warn of a regime that favors further downside tests. Conversely, RSI grinding toward 65–70 and MACD widening positively validates upside continuation.
Editorial Statement
This research is a technical analysis commentary prepared for informational purposes only. It is not investment advice, an offer, or a solicitation to buy or sell any financial instrument. The analysis relies strictly on the provided snapshot data and the three cited external references; it does not account for your objectives, financial situation, or risk tolerance. Markets can move quickly and unpredictably. Always perform your own due diligence and consider consulting a qualified financial professional before making trading or investment decisions. Past performance and historical relationships are not guarantees of future results.
Putting It All Together
GC=F enters the coming week with a mild bullish tilt anchored by price above the SMA20 and SMA50, a positive MACD above its signal, and an RSI in the mid-50s. The market sits roughly 1% below a widely watched resistance level at 3,435 (per Investopedia) and about 2% above a layered support zone near 3,314–3,342 (per Reuters), with the moving averages providing an intermediate cushion. This geometry—resistance just above, support layers below—often produces two-way trading until a definitive catalyst emerges.
Our base case is a contained range between roughly 3,350 and 3,435, with a bullish skew so long as pullbacks hold the SMA20/SMA50 band. A clean breakout above 3,435 would validate a push toward the low 3,500s in the near term and could set the stage for higher-timeframe objectives over time. On the other hand, repeated failures at resistance coupled with momentum compression would first point to 3,364/3,352 and then to the 3,342/3,314 static supports. A break below the latter would shift the tactical lens to 3,300 and potentially 3,245.
Until proven otherwise by price, the market’s playbook remains: respect the supports, watch for a measured approach into 3,435, and let momentum confirmation (RSI and MACD behavior) dictate whether the next tactical leg is an upside continuation or a mean-reversion rotation. The setup is balanced, the ranges are defined, and the triggers are close. Discipline around these signposts should serve market participants well in the days ahead.