Silver Futures (SI=F) Weekly Technical Analysis:
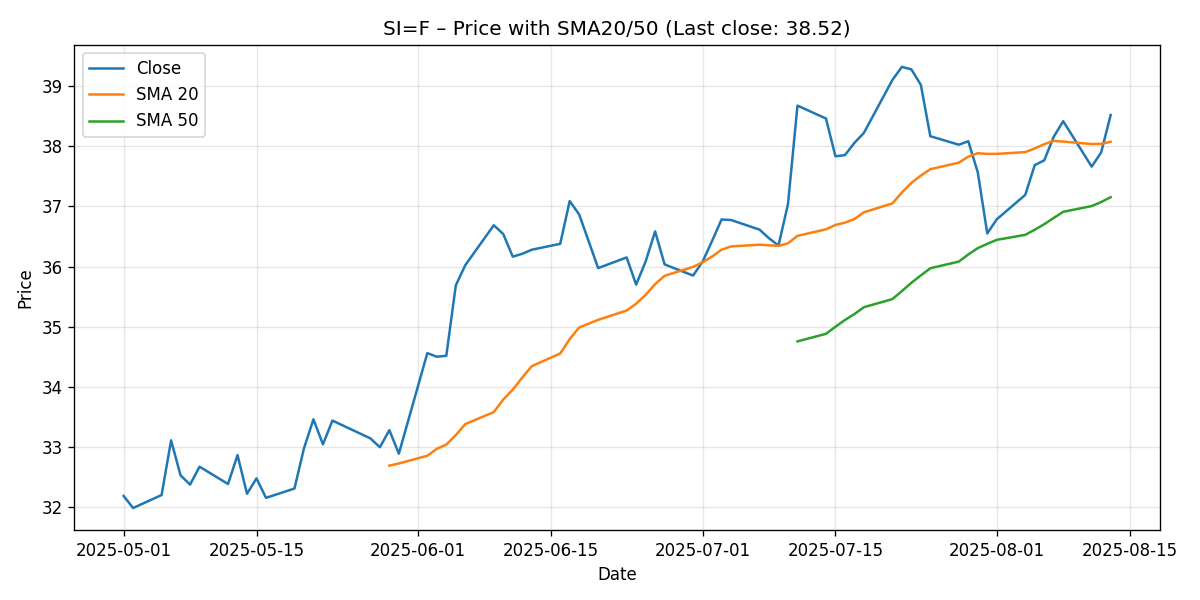
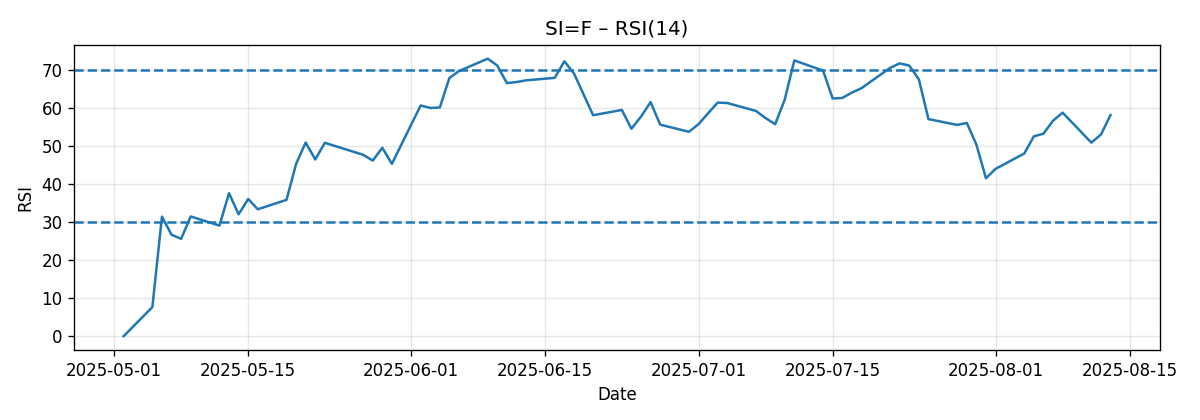
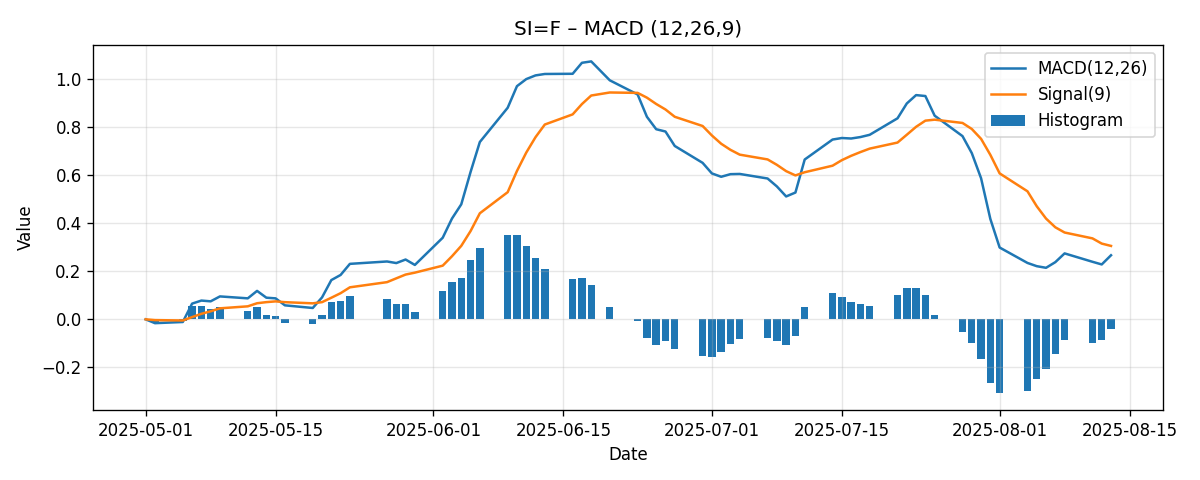
Data reference: 7-day snapshot through 2025-08-13 18:40 UTC. Last close: 38.52; Weekly change: +2.21%; RSI(14): 58.20; MACD(12/26/9): 0.27 vs. signal 0.31; SMA20: 38.07; SMA50: 37.15.
Executive Summary
Silver futures (SI=F) extended their upward trajectory over the past week, closing at 38.52 and adding 2.21% week-over-week. Price sits above both the 20-day and 50-day simple moving averages, and the 20-day is above the 50-day—conditions that typically denote a constructive trend structure. Momentum, however, is showing early signs of moderation: RSI(14) is firm but not overbought at 58.20, and the MACD line (0.27) has slipped just beneath its signal line (0.31), leaving a slightly negative histogram. This juxtaposition—price strength vs. momentum deceleration—often precedes a period of consolidation or a shallow pullback before the trend attempts a further leg higher.
Key conclusions and implications for the coming week:
- The trend remains upwardly biased above the SMA20 (38.07) and SMA50 (37.15). A daily close back below 38.07 would be the first warning that momentum is waning more materially.
- Upside attention clusters in the 39.00–40.00 zone. Round-number psychology and the upper end of widely discussed targets make $40 a near-term over/under.
- The MACD’s soft crossover beneath its signal suggests vigilance: a pause or shallow backfill toward 38.20–38.00 is plausible if buyers hesitate at 39–40.
- Scenario ranges for next week:
- Bullish: 39.60–40.20 if 39.00 gives way on strong follow-through.
- Bearish: 37.10–37.80 on failure at 39.00 and a daily close below 38.07.
- Most-likely: 38.00–39.20 consolidation with upward bias while above 38.07.
Relative to three external predictions, our near-term view aligns with the notion that $38–$40 is a logical target band after a breakout (as discussed by IG), but we are more cautious about a rapid advance beyond $40 in the immediate week due to moderating momentum (MACD below signal). Medium-term projections into the low 40s (Reuters) and $40 by year-end/$50 by 2026 (Kitco) remain feasible macro pathways if the $40 threshold is cleared and sustained, but those are not our base case for next week.
Weekly Market Context & Trend
Over the past 7 trading days captured by this snapshot, silver futures rose 2.21%, closing at 38.52. This advance builds upon a broader 2025 theme of heightened interest in precious metals, with several outlets highlighting the strength of the move. Reuters recently noted that “Silver’s hot streak gathers pace; market at highest since 2011,” adding that “Spot silver prices may hit $42 per ounce this year, according to Shiels” (Reuters). While our analysis focuses squarely on the technicals within the provided data window, the broader narrative helps contextualize why dips have been bought and why round-number resistance levels like $40 are attracting attention.
Technically, the current alignment is constructive:
- Price above SMA20 (38.07) and SMA50 (37.15).
- SMA20 above SMA50, indicating short-term trend strength exceeds the intermediate-term baseline.
- RSI(14) at 58.20—bullish but not stretched.
Yet, the MACD is a touch below its signal, suggesting momentum is less forceful than price alone implies. This nuance often signals a “breather” phase within an uptrend, where price either digests gains by moving sideways in a tight range or retraces modestly to retest nearby moving averages. In short: the trend backdrop is favorable, but the slope of ascent may shallow near 39–40 unless new buying energy materializes.
Detailed Technicals (Price, SMA20/50, RSI14, MACD 12/26/9)
Price and Simple Moving Averages (SMA20 and SMA50)
The last close at 38.52 situates silver modestly above its 20-day SMA at 38.07 and comfortably above its 50-day SMA at 37.15. The absolute and relative positioning matter:
- Distance from SMA20: roughly +0.45 (about +1.2%), indicating price is not excessively extended from its short-term mean.
- Distance from SMA50: roughly +1.37 (about +3.7%), showing healthy separation without near-term overextension.
- SMA20 above SMA50: confirms that the more recent trend has been stronger than the intermediate trend and sustains a bullish bias.
These relationships typically favor buying dips into the 38.20–38.00 region, as long as pullbacks are orderly and daily closes remain above the 20-day average. A decisive daily close below 38.07 would be the first tactical “amber light.” The more consequential marker is the 50-day average near 37.15; losing that level would constitute a stronger signal that the intermediate uptrend is under pressure.
RSI(14): Momentum, But Room Before Overbought
RSI(14) prints at 58.20. Classic RSI interpretation places 50 as a neutral midline and 70 as the typical overbought threshold. At 58, silver shows constructive momentum but still has headroom before typical overbought concerns arise. This is consistent with a trend that has advanced but is not yet overextended on this oscillator.
What does that suggest for next week? Two takeaways:
- There is room for an extension to test 39–40 before RSI risks immediate overbought readings, especially if price rises in a measured fashion.
- If price chops sideways and RSI drifts back toward 50 without significant price damage, that would be a healthy consolidation, resetting momentum for a later attempt higher.
In practical trading terms, an RSI holding above 50 while price holds above the 20-day average is generally the “trend intact” condition. A sustained slip of RSI toward the low-50s or high-40s alongside a daily close below 38.07 would warn that momentum is not just pausing but deteriorating.
MACD (12/26/9): Positive, But Signal-Line Friction
The MACD line sits at approximately 0.27, with the signal line at approximately 0.31. The resulting histogram is slightly negative. This tells us momentum is still positive in absolute terms (MACD > 0), but the rate of change is slowing (MACD < signal). In practical terms, this helps explain why price has continued to grind higher but may struggle to accelerate through nearby resistance without a fresh catalyst.
Typical patterns from this configuration include:
- Sideways consolidation while the histogram oscillates around zero, letting moving averages “catch up.”
- Brief dips toward the 20-day average, where buyers test their resolve.
- Alternatively, a sharp momentum re-acceleration would flip the histogram positive again if buyers defend pullbacks and push through 39–40 decisively.
Given the broader bullish structure (price above both SMAs), the MACD’s softness is cautionary rather than outright bearish. It argues for disciplined entries near support rather than chasing at resistance in the very near term.
Key Levels (Support/Resistance)
Below are the key levels we are tracking for the forthcoming week. Where applicable, we include the basis for the level (moving averages, psychological round numbers, or externally referenced thresholds) and the tactical implication if tested.
| Level (USD) | Type | Basis | Implication if Broken |
|---|---|---|---|
| 40.00 | Resistance | Round-number psychology; upper bound of common near-term targets discussed publicly | Break and hold above 40.00 opens room toward low 40s in coming weeks if momentum expands |
| 39.00 | Resistance / Near-term pivot | Round-number friction just overhead | Clearing 39.00 would likely re-energize momentum toward 39.60–40.20 |
| 38.52 | Pivot (reference) | Last close | Trading above 38.52 early next week supports continuation; below could invite a test of SMA20 |
| 38.07 | Support | 20-day SMA | Daily close below weakens the short-term uptrend and increases odds of 37s |
| 38.00 | Support | Round-number; near SMA20 | Loss of 38.00 would likely accelerate a move toward the 50-day |
| 37.15 | Support (major) | 50-day SMA | Break risks a broader corrective phase; trend questions emerge |
| 35.40 | Support (structural) | Externally highlighted breakout threshold per IG | Loss would undermine the larger breakout, shifting medium-term tone to neutral |
Scenario Analysis: Next Week Price Projections
Below are three well-defined scenarios for the coming week, grounded in the current technical state and the levels above. These are not predictions but structured pathways to frame risk and opportunity.
Bullish Scenario (Break-and-Extend)
- Trigger: Early strength sustains above 38.52, then clears 39.00 on improved breadth and participation. A positive inflection in the MACD histogram would be a confirming tell.
- Rationale: RSI has room to rise before overbought; price is already above both SMAs; the 20-day above the 50-day supports trend continuation.
- Projection: 39.60–40.20 over the next week, with intraday excursions possible just above 40.00 if momentum accelerates. Respect 40.00 as a magnet and potential stall point on first test.
- Invalidation: A daily close back below 38.07 (SMA20) would argue the break lacked stamina and favors reassessing risk.
Bearish Scenario (Fail-and-Fade)
- Trigger: Price fails to sustain any bids above 38.80–39.00, momentum measures (MACD histogram) stay negative, and a daily close occurs below 38.07.
- Rationale: MACD is below its signal; failure near round-number resistance could see sellers press for a moving-average retest.
- Projection: 37.10–37.80, probing the 50-day SMA region (37.15) before buyers attempt to stabilize. This would be a routine pullback within a broader uptrend unless 37.15 fails on a closing basis.
- Invalidation: A decisive reclaim of 39.00 with improving momentum would negate the bear skew.
Most-Likely Scenario (Range-and-Respect)
- Trigger: Momentum remains mixed; buyers defend dips near 38.20–38.00, but overhead supply near 39.00–39.20 caps rallies initially.
- Rationale: The MACD’s soft stance and RSI near 58 suggest consolidation is plausible before a larger move; support from SMA20 should attract dip buyers.
- Projection: 38.00–39.20 weekly range, with a slight upward tilt. If late-week buying improves, an extension toward 39.60 could occur, setting up a more consequential 40.00 test in subsequent sessions.
- Invalidation: A daily close below 38.00 would shift bias toward the bearish scenario; a fast break through 39.20 with rising momentum would shift toward the bullish scenario.
Comparative Outlook: What Others Are Saying vs. Our View
We compare our near-term technical stance with three external perspectives, each offering different horizons and triggers.
1) IG: Breakout Threshold and Target Band
IG recently observed: “If silver breaks through $35.40 on volume, the next target could be $38–40.” (IG)
Assessment and alignment:
- Price is now 38.52—within IG’s 38–40 target band. From a pure technical standpoint, IG’s mapped progression has largely played out.
- Our near-term analysis concurs that 38–40 is the operative zone. We also treat 40.00 as the near-term inflection because round-number resistance often requires multiple attempts to clear, especially when momentum is decelerating (MACD < signal).
- Where we add nuance is timing: our MACD read suggests consolidation risk beneath 40 before any sustained breakout. In other words, we align on targets but are cautious about the pace.
2) Reuters: Potential for $42 This Year
Reuters highlighted that “Spot silver prices may hit $42 per ounce this year, according to Shiels.” (Reuters)
Assessment and alignment:
- This is a broader 2025 target (not a weekly call). Our present positioning above both SMAs is consistent with an intermediate-term uptrend that could advance toward the low 40s—if the $40 gateway gives way and momentum re-accelerates.
- Our difference lies in horizon and immediacy: we do not see $42 as the base case for the coming week given the current momentum slowdown (MACD below signal) and the typical stickiness of first approaches to round-number resistances like 40.
- Should silver close convincingly above 40.00 and convert it into support, the pathway toward 41–42 over a subsequent multi-week window would look more credible.
3) Kitco: $40 by Year-End, $50 by 2026
Kitco’s technical commentary noted: “Silver could reach $40 by the end of the year and $50 by 2026.” (Kitco)
Assessment and alignment:
- Our near-term range (with a possible extension to 39.60–40.20 in the bullish scenario) aligns with the idea that $40 is both visible and meaningful.
- We refrain from extrapolating to $50 within the confines of a one-week technical framework. That said, if the structure holds above rising moving averages and $40 converts to support, the longer-term thesis gains plausibility.
- In summary, we align with $40 as a pivotal waypoint. The leap from 40 to 50 requires sustained trend health and likely pauses; our immediate focus remains on the integrity of supports at 38.07 and 37.15.
Risk Factors & What Could Invalidate the Setups
Technical setups operate within a dynamic market. The following factors could alter the outlook quickly:
- Momentum Slippage Persists: If the MACD line remains below its signal and the histogram deepens negative, price may fail repeatedly near 39.00, dragging RSI back toward 50 and forcing a retest of 38.07. Repeated tests typically weaken support, raising the odds of a 37-handle probe.
- Loss of the 20-Day SMA (38.07) on a Daily Close: This would be the earliest and clearest warning that the short-term uptrend is being challenged. The next expectation would be a reflection toward the 50-day SMA (37.15).
- Decisive Break of the 50-Day SMA (37.15): Closing below the 50-day would signal a more meaningful trend shift, invalidating the bullish medium-term posture and opening a path toward deeper supports (e.g., the externally referenced 35.40 threshold from IG).
- Round-Number Overhang at $40: Psychologically significant levels often produce false breaks. A brief push through 40 followed by a quick reversal (a “failed breakout”) would embolden sellers and could trigger a swift mean reversion back into the high 38s or mid-37s.
- Market-Wide Risk Events: While this analysis is technical, broader cross-asset volatility can whipsaw precious metals. Sharp risk-on swings or liquidity shocks may distort clean technical reads in the short run, leading to overshoots of the levels above.
Monitoring framework for invalidation and confirmation:
- Confirmation of Strength: A sequence of higher highs and higher lows above 38.07, combined with a MACD histogram that flips positive, would validate attempts on 39.60 and possibly 40.00.
- Early Warning of Weakness: Intraday pops that consistently fade below 39.00/39.20, coupled with daily closes near or under 38.07, would counsel caution and hedging/trimming by technically oriented participants.
Putting It All Together: A Structured Trading Playbook
For traders and risk managers who anchor decisions to objective technical triggers, the following distilled playbook synthesizes the analysis above. Note: This is not advice; it is a framework built from the provided technical snapshot.
- Trend Bias: Constructive while above 38.07 (SMA20) and 37.15 (SMA50). The slope of the advance may moderate near 39–40 unless momentum re-accelerates.
- Breakout Trigger: Above 39.00 on strengthening momentum (watch for a rising MACD histogram). Target extension: 39.60–40.20.
- Buy-the-Dip Zone: 38.20–38.00 into the 20-day average—only while RSI holds above the midline and momentum stabilizes.
- Stop/Invalidation Logic: Daily close below 38.07 warns; below 37.15 indicates a deeper corrective phase is underway.
- Do-Not-Chase Area: First approaches to 39.80–40.00 often produce stalls or shallow pullbacks, especially with a soft MACD. Confirmation is key.
Extended Context: External Views and Medium-Term Waypoints
We emphasize that our core lens here is the weekly technical configuration. Still, it is helpful to frame intermediate milestones against external commentary:
- 38–40 Target Band: IG’s threshold-based roadmap placed this as the next target after a $35.40 breakout (IG). Price now resides within this zone, making $40 the immediate line of interest.
- Low 40s Potential: Reuters cited a $42 potential for spot silver in 2025 (Reuters). If (and only if) $40 converts to support, the low 40s become a credible extension over a subsequent multi-week horizon.
- $40 Near-Term and $50 Longer-Dated: Kitco’s commentary frames $40 as a reachable milestone by year-end and $50 by 2026 (Kitco). Our current read supports the near-term relevance of $40; longer-dated milestones are contingent on trend integrity through periodic consolidations.
Practical Indicators to Watch Next Week
To maintain a disciplined approach during the coming sessions, tracking the following will help interpret the evolving tape:
- Daily Closes vs. SMA20 (38.07): The first line of defense for the uptrend. Buyers want to see price respect this moving average on closing bases.
- MACD Histogram Direction: A turn back to positive would validate upside attempts. Persistently negative histogram readings would flag consolidation risk or a deeper mean reversion.
- RSI Behavior Around 60–65: Another push into the low 60s with price knocking on 39.6–40.0 would signal an attempt to stretch; failure to do so suggests range consolidation.
- Round-Number Reactions: Responses at 39.00 and 40.00 will likely define the week’s character. Clean breakouts should show follow-through; repeated rejections often lead to range chops.
Bottom Line
Silver’s weekly setup is “bullish but patient.” Price strength above key averages is undeniable, yet momentum’s softening tone argues for selectivity near resistance and readiness to buy dips into supportive zones. We anchor our near-term focus to 38.07 (SMA20) and 39–40 resistance, with 37.15 (SMA50) marking the boundary between a routine pullback and something more concerning. Our base case anticipates a constructive consolidation between 38.00 and 39.20, with the potential for a late-week extension toward 39.60–40.20 if momentum improves. A decisive and sustained break above 40.00 would upgrade the intermediate outlook, pulling forward the conversation about 41–42 in the weeks that follow.
Editorial Statement
This analysis is for informational and educational purposes only and reflects a technical reading of the provided snapshot data and cited sources at the time noted. It is not investment advice, an offer, or a solicitation to buy or sell any instrument. Market conditions can change rapidly. Always perform your own due diligence and consider consulting a qualified financial professional before making trading or investment decisions. The author and publisher assume no responsibility for any actions taken based on this analysis.
Appendix: Data Points Referenced
- Ticker: SI=F (Silver futures)
- Data generated at: 2025-08-13T18:40:02.805522Z
- Last close: 38.52
- Week-over-week change: +2.21%
- RSI(14): 58.20
- MACD(12/26/9): 0.27
- MACD signal: 0.31
- SMA20: 38.07
- SMA50: 37.15
Sources Cited
- IG: “What’s driving silver’s price rally in 2025?” – “If silver breaks through $35.40 on volume, the next target could be $38–40.” Link
- Reuters: “Silver’s hot streak gathers pace; market at highest since 2011” – “Spot silver prices may hit $42 per ounce this year, according to Shiels.” Link
- Kitco: “Silver: Technical breakout or fakeout?” – “Silver could reach $40 by the end of the year and $50 by 2026.” Link