WTI Crude Oil (CL=F) Weekly Technical Analysis:
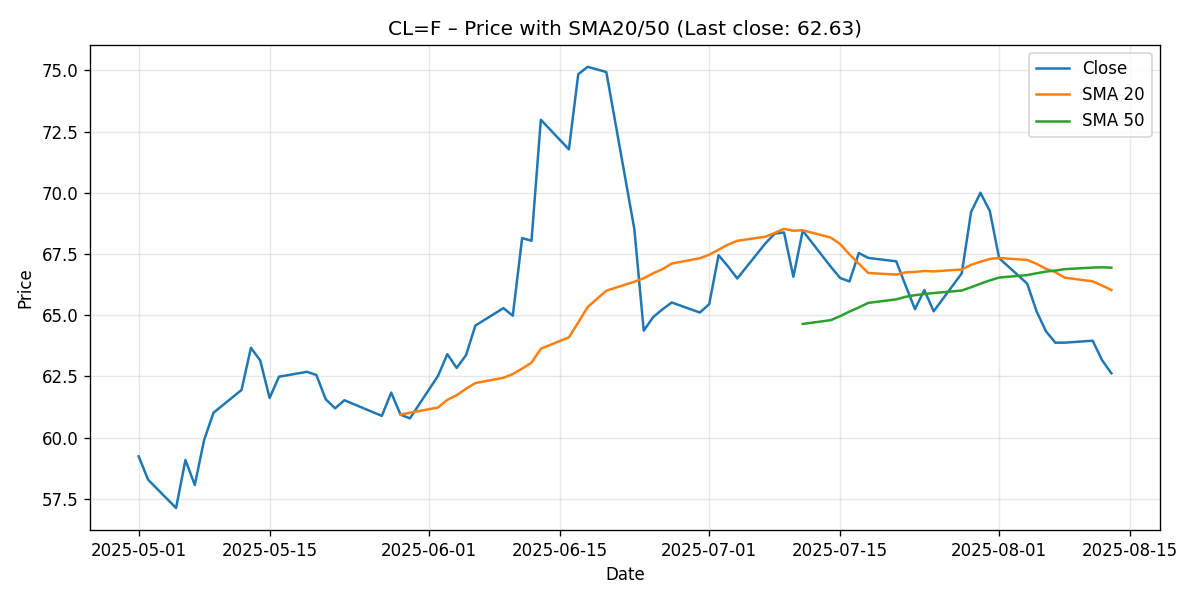
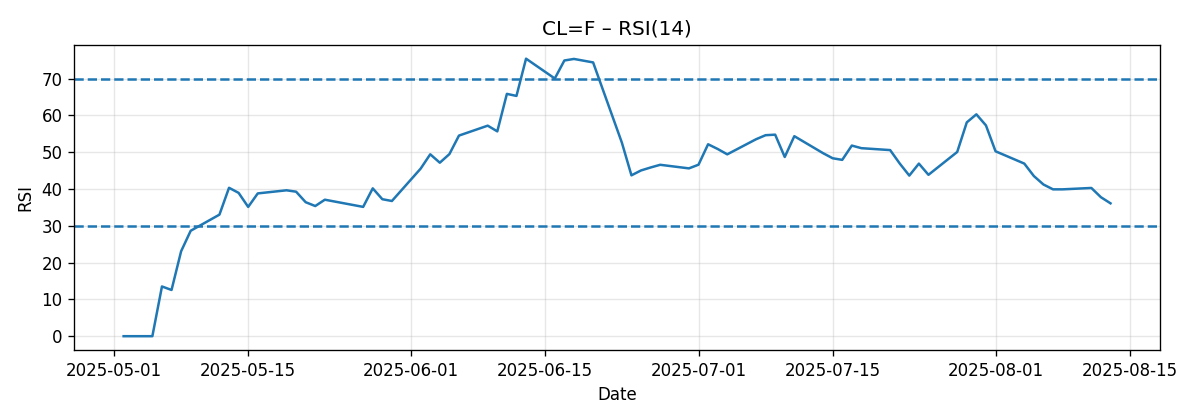
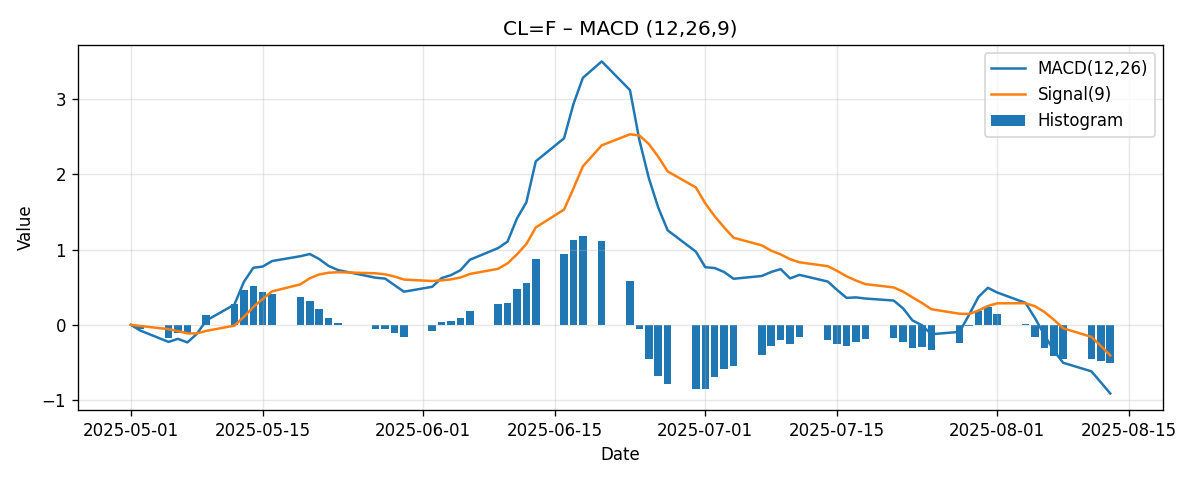
WTI crude oil futures (CL=F) ended the week under pressure, settling at 62.63 with a weekly decline of roughly 3.88%. The market is now trading decisively beneath both its 20-day and 50-day simple moving averages, while momentum indicators tilt bearish: the RSI(14) sits at 36.11 (bearish but not yet oversold), and the MACD histogram remains negative with the MACD line below its signal. This configuration paints a picture of a market where sellers still have the initiative, even as prices approach psychologically significant round-number supports in the low-$60s.
Executive Summary
- Last close: 62.63 (down about 3.88% on the week).
- Trend positioning: Price is below the 20-day SMA (66.03) and 50-day SMA (66.94) — a bearish alignment.
- Momentum: RSI(14) at 36.11 indicates weak momentum but not yet oversold. MACD at -0.91 vs. signal at -0.41 underscores persistent downside pressure.
- Bias: Near-term bearish to sideways with elevated risk of a probe toward 62.00–61.00 unless momentum stabilizes.
- Key tactical zones: Resistance layers around 64.00–65.00, then the 20-day SMA near 66.03 and the 50-day SMA near 66.94. Supports near 62.00, 61.00, and the major psychological 60.00.
- Next-week scenarios: Base case favors range trade 61.50–64.50, with bearish risk skew if 62.00 gives way; bullish attempts likely capped beneath the 20/50-day SMAs unless momentum turns.
Weekly Market Context & Trend
The technical picture for CL=F this week is best understood against a macro backdrop that continues to lean cautious. While our analysis is strictly technical for near-term trading horizons, medium-term expectations—particularly the relationship between WTI and Brent benchmarks—can shape sentiment and the balance of risks.
Three external views frame the broader context:
- The U.S. EIA’s latest outlook implies softer Brent prices into late 2025: “Brent will average below $60 per barrel in Q4 2025, the EIA forecasts.”
- Citi’s base case is similarly subdued: “Citi projects Brent prices toward the low $60s per barrel by end-2025.”
- A Reuters poll highlights macro headwinds: “Brent seen averaging $67.84 and U.S. crude $64.61 in 2025.” The poll explicitly cites tariff uncertainty and rising OPEC+ supply as drags on prices.
Translating those medium-term macro signals to this week’s tape: WTI’s slip into the low-$60s is directionally consistent with a cautious outlook. The slope of the short-term trend is negative (price under the 20- and 50-day averages), and momentum indicators are weak. While forecasts about 2025 do not determine next week’s price action, they can influence positioning, risk appetite, and the tendency of rallies to fade below overhead resistance. In other words, the technicals are telling us sellers remain in control, and the macro consensus does little to contradict that narrative.
In the short term (this coming week), the battle lines are clear: bulls need to reclaim and hold above the mid-$60s to convincingly shift momentum, while bears will try to lean on any rebounds beneath the 20-day SMA (~66.03) as opportunities to press lower toward 62.00–61.00 and potentially round-number 60.00 if pressure persists.
Detailed Technicals (Price, SMA20/50, RSI14, MACD 12/26/9)
Price Action Relative to the 20- and 50-day SMAs
CL=F closed at 62.63. The 20-day SMA sits at 66.03, and the 50-day SMA at 66.94. With price trading firmly below both averages, the near-term trend is unambiguously bearish. The 20-day is typically the first dynamic resistance that bulls must overcome to signal a change in momentum; the 50-day then acts as a secondary, often more consequential, confirmation level.
- Below 20-day SMA (66.03): suggests short-term momentum remains negative. Rallies into this zone are likely to meet supply.
- Below 50-day SMA (66.94): the broader swing trend is also weak; for many trend-followers, being below both SMAs reinforces a sell-the-rip mindset.
- Distance to averages: about $3.40–$4.30 overhead. That gap is large enough to allow bounces, but also underscores that sellers have room to defend rallies before trend shifts.
In practice, the band from 66.00 to 67.00 forms a layered resistance zone. Only a sustained break and hold above 67.00 would materially change the narrative from “rallies to sell” to “dips to buy.” Until then, short-term traders typically expect fading behavior on approaches to the 20/50-day cluster.
RSI(14): Bearish, Not Yet Oversold
The RSI(14) prints at 36.11. That’s in bearish territory but comfortably above the usual oversold threshold (~30). The implications:
- Downside momentum persists, but there’s still room for RSI to fall before traditional oversold signals arise.
- RSI basing above 30 could set up a relief rally, especially if price stabilizes around round-number supports (62, 61, 60).
- Conversely, a push of RSI into the low-30s or below—without a commensurate price break—could create positive divergence later, but there’s no such divergence present in the snapshot; momentum is simply weak.
In short, RSI is bearish, but not exhausted. This configuration commonly produces either continuation to test lower supports or choppy consolidation with capped rallies.
MACD (12/26/9): Negative and Below Signal
The MACD line is at -0.91 versus its signal at -0.41, leaving the histogram negative. A negative MACD below its signal often accompanies established downtrends. What matters tactically is whether the spread between MACD and signal narrows (sign of waning downside momentum) or widens (sign of acceleration).
- Current gap: About -0.50, which is a meaningful spread. As long as this remains, rallies may be fragile.
- Turning point: If price forms higher lows while MACD crosses up through its signal, that would be an early momentum shift. There is no such crossover in the latest reading.
- Zero line: The MACD is below zero, consistent with prices below their longer moving averages and a broader bearish bias.
Key Levels (Support/Resistance)
With price in the low-$60s and momentum bearish, the market’s attention tends to cluster around round numbers and the nearby moving averages. The table below outlines the levels most likely to matter next week, along with their technical rationale:
| Level | Type | Rationale |
|---|---|---|
| 67.00 | Resistance | Round number just above the 50-day SMA (66.94); reclaiming and holding above would be a regime shift signal. |
| 66.94 | Resistance | 50-day SMA; a classic trend filter. Sellers often defend initial tests. |
| 66.03 | Resistance | 20-day SMA; first line of dynamic resistance in downtrends. |
| 65.00 | Resistance | Psychological figure; potential interim selling area on rebounds. |
| 64.00 | Resistance | Round-number shelf; likely initial supply on a bounce from low-$60s. |
| 62.00 | Support | Near-term psychological support and a logical first downside magnet. |
| 61.50 | Support | Mid-figure stepping stone; often probed in weak tapes during intraday extensions. |
| 61.00 | Support | Psychological level; follow-through target on breaks of 62.00. |
| 60.00 | Major Support | Major round number; market often reacts here even in trending environments. |
These levels map a practical path. Bulls would want to build a base above 62.00, then clear 64.00–65.00 and, critically, the 20-day SMA near 66.03. Bears will watch for failures under 64.00–65.00 to fade strength toward 62.00 and possibly 61.00/60.00 if momentum stays heavy.
Scenario Analysis (Next-Week Price Projections)
Given the current technical posture (price below the 20- and 50-day SMAs, RSI at 36, MACD negative), the balance of probabilities favors a bearish-to-sideways week unless we see a momentum inflection. Below are three scenarios with explicit price ranges for next week:
1) Bullish Rebound Scenario
- Projection range: 64.50–66.00.
- Setup: Buyers stabilize price above 62.00, force a push through 64.00, and test into the 20-day SMA zone (near 66.03).
- Confirmation triggers: A daily close above 64.00 followed by follow-through buying; RSI ticks up toward the low-to-mid 40s; MACD histogram starts to contract (less negative).
- Invalidation: A failure back under 62.00 after a rally attempt undermines the rebound thesis.
- Rationale: Even in downtrends, rebounds to the first dynamic resistance (20-day SMA) are common. With RSI not yet oversold, there is room for mean-reversion if sellers step back temporarily.
2) Bearish Continuation Scenario
- Projection range: 60.00–61.80.
- Setup: Price slips below 62.00 early in the week; RSI drifts toward 30–33; MACD remains negative with limited improvement in the histogram.
- Confirmation triggers: Sustained trade below 62.00; intraday rallies fail beneath 64.00; inability to print higher lows.
- Invalidation: A decisive daily close back above 65.00 would weaken bearish momentum and reduce the probability of a 60-handle test next week.
- Rationale: With price below major moving averages and momentum weak, continuation risk is elevated. The 60.00 round-number magnet is a natural downside draw if 62.00 and 61.00 give way.
3) Most-Likely Scenario (Range with Bearish Skew)
- Projection range: 61.50–64.50.
- Setup: A range develops around the 62–64 corridor as the market digests recent declines. RSI hovers in the mid-30s to low-40s; MACD remains negative but shows gradual histogram contraction.
- Confirmation triggers: Multiple failures to break and hold below 62.00 or above 65.00; intraday volatility centered around the 63.00 area.
- Invalidation: A fast break below 61.50 that sticks, or a strong breakout above 65.00 with follow-through.
- Rationale: The technicals argue for caution with a mild bearish bias, but the absence of an oversold RSI and the proximity of psychological supports suggest an initial consolidation rather than a straight-line selloff.
Positioning notes for traders (not advice): In the bearish and base-case scenarios, fading intraday strength below 64.00–65.00 aligns with the trend. In the bullish scenario, a measured approach would look for evidence of momentum improvements (RSI lift, MACD contraction) before pressing for the 66.00 test. Risk management remains paramount around the 62.00 and 60.00 thresholds, which can trigger accelerations if breached.
Comparative Outlook: External Predictions vs. Our View
To cross-check the technical stance with broader expectations, we compare three external calls:
EIA Outlook (Macro Bearish Tilt)
Reuters summarized the EIA’s view: “Brent will average below $60 per barrel in Q4 2025.” While this targets Brent and focuses on a late-2025 horizon, the direction is noteworthy. A soft outlook for Brent, the global benchmark, typically implies persistent headwinds for WTI as well. Our weekly technicals align directionally with this caution: price is below key averages, and momentum is negative. The difference is timeframe. We are analyzing the next week, not next year. Still, the macro forecast helps explain why rallies may struggle to sustain above the mid-$60s near term; macro participants may be inclined to fade strength until forecasts improve.
Citi Base Case (Low-$60s by End-2025)
Citi’s base case via Reuters: “Citi projects Brent prices toward the low $60s per barrel by end-2025.” This call puts Brent in the low-$60s, which, by implication, places WTI in a similar or slightly lower zone, depending on the spread. Presently, WTI at 62.63 is already within that neighborhood. From a weekly technical standpoint, this macro backdrop reinforces the notion that the market may be comfortable exploring the low-$60s without necessarily seeing aggressive dip-buying. That squares with our range-with-bearish-skew base case for next week. Again, we emphasize the near-term nature of our analysis: next week’s path will be determined by reactions at 62.00 and the 64.00–66.00 resistance band, not by long-dated forecasts. Yet, knowing the medium-term consensus can temper expectations for how far a rebound might travel in the absence of a catalyst.
Reuters Poll (Tariffs and OPEC+ Supply as Headwinds)
The Reuters poll highlights: “Brent seen averaging $67.84 and U.S. crude $64.61 in 2025,” while citing tariff uncertainty and rising OPEC+ supply as factors weighing on prices. The poll’s averages are not weekly trade targets, but the message is that risk factors skew to the downside. Our weekly technical stance—bearish bias with potential stabilization around round numbers—fits with a market aware of supply-side and policy uncertainties. The alignment is conceptual: headwinds help explain why the tape acts heavy under the 20- and 50-day SMAs and why rebounds might be sold until the indicators repair.
In summary, the external predictions and polling skew cautious for the medium term, which is consistent with the current technical setup. Our view differs mainly in horizon and trigger sensitivity: we focus on specific price levels and indicators that could shift the narrative next week, even if the broader macro tone remains subdued.
Risk Factors & What Could Invalidate The Setups
Technical setups are probabilistic. Here are the key risks and what could invalidate next week’s expectations:
- Policy and trade uncertainty: The Reuters poll explicitly mentions tariff uncertainty as a drag on prices. Surprises that reduce perceived tariff risks could spark relief rallies, potentially invalidating the bearish skew and pushing WTI through 64.00–65.00 toward the 20-day SMA (~66.03).
- Supply dynamics: The same poll points to rising OPEC+ supply as a headwind. Any unexpected moderation in supply expectations could quickly flip sentiment, especially when the market sits near psychological supports. A swift sentiment shift could convert our most-likely range into a stronger rebound scenario.
- Momentum regime change: From a pure-technical perspective, if RSI climbs through the low-40s and MACD’s histogram contracts meaningfully (or MACD crosses above its signal), the bearish continuation case weakens. A strong daily close above 65.00 would be an early signal that bears are losing control.
- Breakdown acceleration: Conversely, a decisive break under 62.00 that sustains could accelerate losses toward 61.00 and 60.00. In that event, the bullish rebound scenario becomes significantly less probable for the week.
- False breaks and whipsaw risk: In low-60s trade, round numbers can attract both genuine flow and stop-driven volatility. False breaks around 62.00 or 64.00 could whipsaw positioning. Traders should allow for confirmation rather than reacting to the first tick through a level.
Because the market is already trending below its key moving averages, the default risk is that rallies falter until the indicators repair. However, the proximity of psychological supports means volatility around these levels can be sharp. Respect the pivot zones and wait for confirmation from momentum indicators or price closes to avoid being trapped by transient spikes.
Putting It Together: A Cohesive Plan for the Week
The market tone is weak, but not exhausted. Price is below the 20-/50-day SMAs, RSI is subdued at 36.11, and MACD is negative and under its signal. Bears have control, and the path of least resistance remains sideways-to-down unless and until we see concrete evidence of momentum improvement. At the same time, the low-$60s are psychologically important; even within a downtrend, these zones often produce counter-trend bounces.
How that translates into practical expectations:
- Early-week focus on 62.00: A hold builds the case for the base-case range (61.50–64.50). A break invites 61.00 and possibly 60.00.
- First resistance test near 64.00: Expect supply on first touch. A decisive daily close above 64.00 opens room toward 65.00 and the 20-day SMA near 66.03.
- Momentum watch: Look for RSI pushing into the 40s and MACD histogram contraction as tells that a rebound has legs. Absent these, fade rallies beneath SMA20/SMA50 remains a logical posture for trend-followers.
In line with the external consensus (EIA, Citi, Reuters poll), the medium-term macro tone is cautious. That macro backdrop reduces the probability that a single-week rebound extends far beyond the mid-$60s unless a new supportive narrative emerges. Thus, the most probable outcome is a contained range with a bearish tilt, bracketed by 61.50 on the downside and 64.50 on the upside, with tail risks to 60.00 (down) and 66.00 (up) depending on how momentum evolves.
Additional Technical Considerations
While we avoid introducing data not present in the snapshot, a few general technical principles are relevant here:
- Moving average “value zones”: The area between the 20- and 50-day SMAs often acts as a decision zone. A clean break through the 20-day with follow-through toward the 50-day frequently serves as the first confirmation of an improving tape. Conversely, repeated failures at the 20-day typically precede another leg lower.
- Round-number dynamics: Markets frequently respect round numbers (64, 63, 62, 61, 60), especially when momentum is weak. Expect liquidity hunts around these levels. That adds noise risk; insist on closes, not just intraday stabs, to confirm breaks.
- Momentum alignment: RSI and MACD both point down; when both momentum tools agree, trend continuation has higher odds. Look for divergence or signal crossovers as early warnings that the move is maturing.
In short, we are in a classic downtrend phase with potential for choppy counter-trend bounces. Confirmation remains key. Without it, rallies are suspect under the SMA20/SMA50 zone.
Outlook Summary by Indicator
- Price vs. SMA20/SMA50: Bearish. Price at 62.63 is below both 66.03 (SMA20) and 66.94 (SMA50). This alignment favors selling strength until proven otherwise.
- RSI(14): 36.11, bearish but not oversold. Suggests room for continuation lower or a modest bounce; no clear exhaustion yet.
- MACD(12/26/9): -0.91 vs. signal -0.41, negative and below signal. Momentum remains to the downside; no crossover evident.
Actionable Levels Recap
- Bullish reclaim: Above 64.00 to reduce immediate pressure; above 66.03 (SMA20) to challenge bears; above 66.94–67.00 to transition toward a neutral-to-bullish stance.
- Bearish continuation: Below 62.00 opens 61.00; below 61.00 increases odds of a 60.00 test.
- Neutral zone: 62.00–64.00 is likely to be choppy; treat signals in this band with caution unless confirmed by momentum.
Editorial Statement (Disclaimer)
This analysis is provided for informational and educational purposes only and reflects a technical view based solely on the supplied snapshot data and the cited external sources. It is not investment advice, an offer, or a solicitation to buy or sell any financial instrument. Trading and investing in commodities involve substantial risk, including the possible loss of principal. Always conduct your own research and consider your risk tolerance and objectives. Past performance and historical patterns are not guarantees of future results.
We have avoided introducing any data not present in the provided snapshot or the explicitly linked external articles. Our scenarios are probabilistic, not predictive, and are intended to help map risk and reward around clearly defined technical levels.