BNB-USD Weekly Technical Analysis: Momentum Holds Above Key Averages as RSI Climbs Toward 70
Data snapshot generated at 2025-08-12T15:23:07Z. All analysis below references the provided 7‑day window and metrics.
Executive Summary
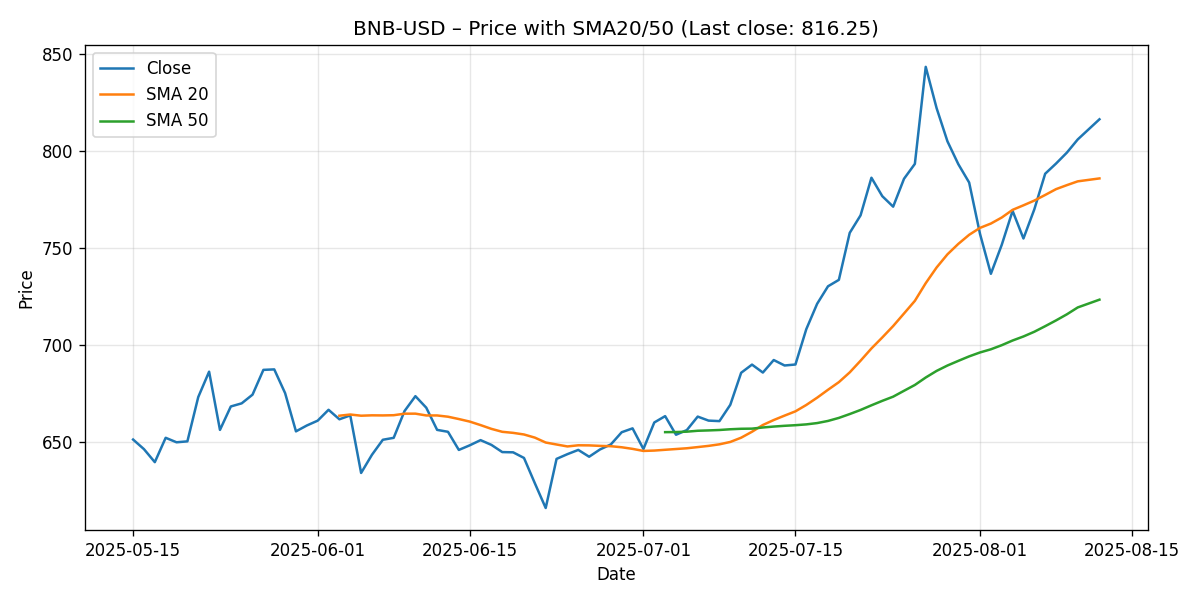
- Price and weekly performance: BNB-USD closed at $816.25, up 8.13% week-over-week in the provided seven-day window.
- Trend posture: Price sits above both the 20-day simple moving average (SMA20: $785.79) and 50-day simple moving average (SMA50: $723.33). The short-term average (SMA20) trends above the intermediate (SMA50), a classically bullish alignment.
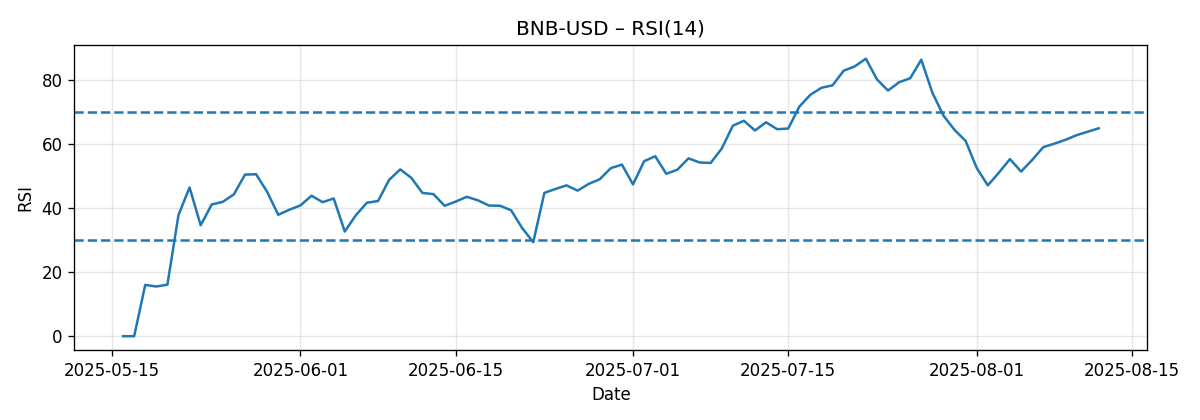
- Momentum: RSI(14) at 64.87 shows constructive momentum, approaching but not breaching the typical overbought threshold (70). This suggests room for continuation with increasing risk of consolidation as RSI nears 70.
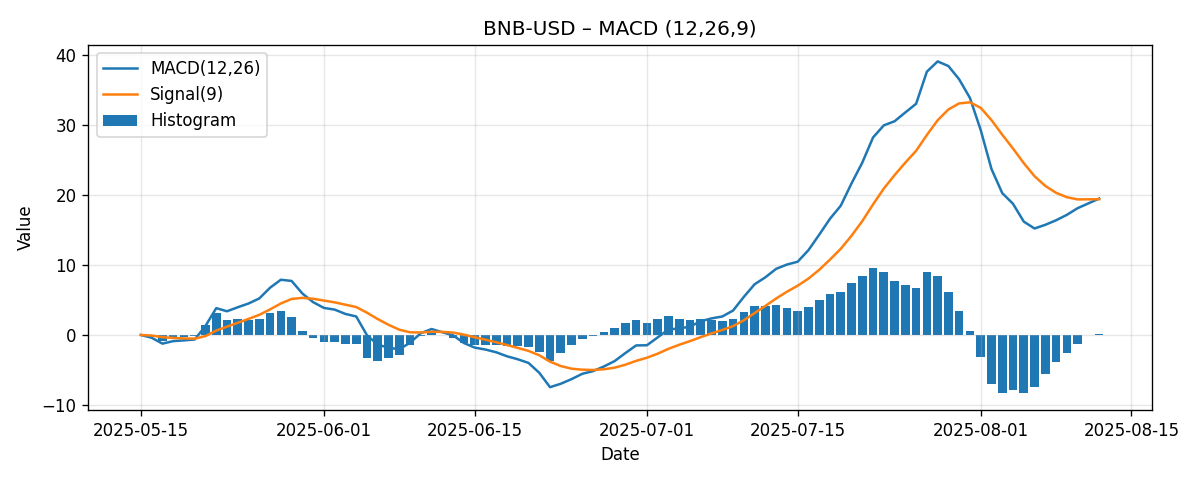
- MACD (12/26/9): MACD line at 19.45 is marginally above its signal at 19.36; histogram is slightly positive (~0.09). This indicates bullish momentum that is positive but not emphatic—i.e., continuation is possible, but the impulse is not currently surging.
- Market bias: Near-term bias remains upward while price holds above $800 and especially above the rising SMA20 (~$785.79). Momentum is constructive, but with RSI nearing 65, the market could oscillate between brief extensions and shallow pullbacks.
- Key levels in focus: Supports at $800 (psychological), $785.79 (SMA20), and $723.33 (SMA50). Former resistance zones from external coverage (around $674 and $660) have been surpassed and now sit as deeper supports. Overhead, round-number areas at $850 and $900 are the next psychological checkpoints.
- Next-week scenarios (non-predictive ranges):
- Bullish: $840–$880, with a stretch toward $900 if momentum accelerates.
- Most-likely: $790–$850 consolidation while maintaining trend above SMA20.
- Bearish: $760–$785 if price loses $800 and tests the SMA20; deeper pullback risk toward $723 (SMA50) if momentum fades.
Weekly Market Context & Trend
BNB-USD advanced 8.13% over the last week, closing at $816.25 in the provided snapshot. The climb occurred with price maintaining elevation above both the 20-day and 50-day simple moving averages. The short-term average (SMA20) currently sits at $785.79, while the SMA50 is lower at $723.33. This configuration—price above SMA20 above SMA50—reflects a trend structure that remains intact and supportive of buying the dip rather than chasing acceleration, particularly with momentum indicators edging toward upper ranges.
From a trend lens, several takeaways stand out:
- Stacked averages indicate buyers are in control across short and intermediate time frames.
- The spread to the SMA20 is approximately $30.46, or about 3.88%. This premium suggests the market is trending but not severely extended relative to its 20-day trend baseline.
- The spread to the SMA50 is roughly $92.92 (about 12.85%), indicating a more notable cushion over the intermediate trend—a buffer that can absorb modest pullbacks without endangering the broader uptrend.
- Momentum is constructive but not overheated: RSI(14) at 64.87 is below the overbought threshold and the MACD histogram is only marginally positive, signaling the uptrend is present but not in a blow-off phase.
Given this backdrop, the path of least resistance remains upward while the SMA20 holds as dynamic support. However, with RSI edging closer to 70 and MACD momentum modest, the next week may favor oscillations within an upward bias—i.e., measured climbs punctuated by shallow consolidations, often around round numbers or moving averages.
Detailed Technicals (Price + SMA20/50, RSI14, MACD 12/26/9)
Price and Moving Averages
Last close: $816.25
- SMA20: $785.79
- SMA50: $723.33
Interpretation:
- Trend alignment is bullish: price > SMA20 > SMA50.
- Distance to SMA20 (~3.88%): implies a manageable extension that can be retraced without trend damage if a short-term pause develops.
- Distance to SMA50 (~12.85%): highlights a sturdier intermediate uptrend; a pullback to the 50-day average would represent a more material but still trend-preserving correction.
Operationally, the SMA20 (~$785.79) is the first line of dynamic support. If price holds this level on dips, the trend remains healthy. A sustained break under the SMA20 would shift focus to the $760–$770 zone (generalized buffer below a freshly rising 20-day baseline), and then to the SMA50 (~$723.33) as the next critical area.
RSI(14)
RSI(14): 64.87
Interpretation:
- RSI at 64.87 indicates positive momentum without an overbought condition. The market has scope to push higher before the likelihood of mean reversion increases substantially.
- A move above 70 would elevate the risk of a short-term pullback or sideways digestion, particularly if price extends far above the SMA20 concurrently.
- Conversely, an RSI dip back toward the mid-50s while price holds above SMA20 would typically reflect consolidation within an ongoing trend rather than a full trend reversal.
Tactical implication: A continuation higher is plausible, but momentum traders should be cognizant of waning incremental thrust as RSI approaches 70. That dynamic often shifts the optimal strategy from chasing breakouts to buying pullbacks toward moving averages.
MACD (12/26/9)
MACD line: 19.45
Signal line: 19.36
Histogram: ~+0.09
Interpretation:
- The MACD line is marginally above its signal, signifying a bullish bias but with limited impulse at the moment.
- A widening positive histogram would add confidence to upside follow-through; conversely, a flattening or negative turn in the histogram while price stalls near round-number resistance would raise the probability of a near-term pause.
- Given the modest histogram, traders should look for confirmation from price behavior around the SMA20 and key psychological zones (e.g., $800, $850).
Key Levels (Support/Resistance)
The following levels synthesize the provided moving averages, widely observed psychological thresholds, and historical references from external coverage that noted prior resistance in the mid-$600s. Levels near round numbers are labeled as psychological; the SMA-derived levels come directly from the provided snapshot; and historical references are attributed.
| Level | Type | Source | Notes |
|---|---|---|---|
| $900 | Resistance | Psychological | Major round number; often attracts supply on first tests. |
| $880 | Resistance | Psychological | Interim round-area checkpoint ahead of $900. |
| $850 | Resistance | Psychological | Nearest clean round number above the last close; potential first resistance band. |
| $830 | Resistance | Psychological | Minor round-area zone; useful as an initial gauge of near-term supply. |
| $816.25 | Reference | Snapshot close | Last close from the provided data; not a support/resistance per se, but an anchor. |
| $800 | Support | Psychological | Nearest psychological level below price; often tested during consolidations. |
| $785.79 | Support | SMA20 | First dynamic trend support; holding above maintains short-term uptrend. |
| $760 | Support | Psychological | Secondary psychological cushion if SMA20 wobbles; buffer area, not from indicator. |
| $723.33 | Support | SMA50 | Key intermediate trend support; loss would weaken the broader uptrend. |
| $674 | Support | Historical reference | Referenced as resistance in June external coverage; now deeper support if retested. |
| $660 | Support | Historical reference | Referenced as consolidation area in July external coverage; deeper structural support. |
Scenario Analysis (Bullish / Bearish / Most-Likely)
These scenarios are analytical frameworks based on the provided technical snapshot and common market behaviors. They are not predictions and do not constitute financial advice.
Bullish Continuation Scenario
Rationale: Uptrend structure is intact (price > SMA20 > SMA50), RSI is supportive but not yet overbought, and MACD remains marginally positive. If buyers defend the $800 area and dips into the SMA20 are bought, a grind higher is feasible.
- Trigger/confirmation: Sustained holds above $800 with higher intraday lows, or a clean push/hold above a nearby resistance checkpoint such as $830–$850.
- Momentum tell: RSI pushing toward 68–70 with MACD histogram expanding positively.
- Next-week price projection: $840–$880, with an upper stretch toward $900 if momentum improves.
- Invalidation clues: Failure to hold $800 on closing bases coupled with a rollover of RSI back toward 55–50 and a flattening/negative MACD histogram.
Bearish Pullback Scenario
Rationale: With RSI nearing 65 and MACD momentum modest, a pause or shakeout could develop if the market fails to build on gains. Round-number resistance can prompt short-term profit taking.
- Trigger/confirmation: Rejection near $830–$850 followed by loss of $800 support on closing bases.
- Downside targets: First, the SMA20 at $785.79; if momentum deteriorates, a drift into the $760s is possible. Deeper risk extends to the SMA50 around $723.33.
- Next-week price projection: $760–$785 if downside momentum persists after losing $800; a deeper test could touch the low $720s if selling accelerates, though that would be a larger swing.
- Invalidation clues: Swift reclaim of $800 and a return to higher lows above the SMA20 with RSI stabilizing above 60.
Most-Likely Range-Bound Drift (Trend Maintenance)
Rationale: The market’s internals suggest a constructive trend but without aggressive momentum. That often translates into a grind or range while remaining above the key moving averages.
- Expected behavior: Chop between supports at $800–$786 and resistances near $830–$850, with dips toward the SMA20 being bought.
- Next-week price projection: $790–$850, skewed to the upside so long as $785.79 (SMA20) holds on a closing basis.
- Evolution: A strong close above $850 would tilt the range higher toward $880–$900. Conversely, repeated closes below $786 would transition to the bearish pullback scenario.
Comparative Outlook: External Predictions vs. This View
We cross-reference three external viewpoints and compare them with the current technical stance derived from the provided snapshot.
1) Multi-year pattern breakout and cycle target
External view (Cointelegraph): “BNB has broken out of a multi-year ascending triangle, a bullish continuation pattern.” Some analyses discussed a cycle-top potential around $2,000.
Alignment with our snapshot-based read: The price trading above both SMA20 and SMA50 supports the notion of a bullish phase consistent with a prior pattern breakout. Our RSI and MACD readings, however, capture the near-term, not the cycle horizon. While the structural breakout narrative aligns with the uptrend we observe, our weekly framing tempers expectations, highlighting that momentum is currently constructive but incremental (MACD histogram just mildly positive). In short, the long-term bullish thesis and our near-term technicals are directionally consistent, but our focus emphasizes tactical execution around moving averages and managing overbought risk as RSI approaches 70.
2) Mid-$600s consolidation and resistance references
External view (CoinDesk, July 7, 2025): “Technical analysis suggests that BNB is consolidating, with buyers supporting the price around $659.45 and sellers capping gains at $664.38.”
External view (CoinDesk, June 11, 2025): “The token’s performance is being closely watched, particularly around the $674 resistance level, which could indicate a breakout if surpassed.”
Alignment with our snapshot-based read: Those prior mid-$600s zones function as context for how far price has moved since. With BNB now at $816.25 in the snapshot, the $660–$674 area has transitioned into deeper support territory in our levels table. Our current analysis therefore treats those historical resistances as later-stage supports, consistent with the principle of polarity (resistance turning into support after a successful breakout). The presence of price well above SMA20 and SMA50 provides a technical underpinning to that transition.
3) Long-term institutional forecasts
External view (FXStreet summarizing Standard Chartered): “Standard Chartered predicts BNB could hit $2,775 by 2028.” Relatedly, Cointelegraph reported a nearer-term view: “Asset manager Standard Chartered predicts that Binance’s ecosystem token, BNB, could more than double in price this year.”
Alignment with our snapshot-based read: These are strategic, multi-quarter horizons, whereas our analysis is a weekly technical review. Current momentum and trend posture are supportive of the long-term optimistic case, but our MACD histogram’s modest positive read underscores that the present impulse is not extreme. Our conclusions are therefore compatible with a broader uptrend narrative but maintain a focus on near-term levels, risk management, and the possibility of pullbacks even within strong secular trends.
Risk Factors & What Could Invalidate The Setups
Technical risks
- Loss of $800 followed by a close below the SMA20 ($785.79) would weaken near-term momentum and shift the focus to the $760s and then the SMA50 (~$723.33).
- Bearish momentum crossover: If the MACD histogram turns negative and expands while RSI falls back toward the 50–55 band, it would signal momentum deterioration and raise the likelihood of testing the SMA50.
- Failed breakout at round numbers: Repeated failures near $850–$880 could invite profit taking and range reversion.
Market structure and liquidity risks
- Crypto markets can experience abrupt liquidity pockets around weekends, holidays, or during macro data releases for other asset classes, leading to outsized wicks beyond technical levels.
- Correlation shocks: If broader crypto beta (e.g., large-cap peers) experiences a sharp drawdown, BNB can move in sympathy regardless of its standalone setup.
Regulatory and idiosyncratic risks
- Headlines related to major exchanges, legal developments, or regulatory policy can create gap risk that bypasses nearby technical levels.
- Protocol/ecosystem-specific developments may alter the risk/return balance abruptly.
Invalidation of bullish bias
- Consecutive daily closes below the SMA20, followed by failure to reclaim it, would upgrade the risk of a move toward the SMA50.
- Break and hold below the SMA50 (~$723.33) would be a meaningful trend degradation and invalidate the near-term bullish tilt.
Invalidation of bearish scenario
- Strong advance above $850 accompanied by rising RSI toward 70 and an expanding positive MACD histogram would undermine the bearish pullback setup and favor continuation.
Tactical Takeaways
- The trend is up and intact while price holds above the SMA20. Dips toward $786 have a higher probability of attracting bids in the current configuration.
- RSI near 65 advises against expecting unchecked parabolic acceleration without pauses; look for a pattern of grind, brief overextensions, and controlled retracements to moving averages.
- MACD’s small positive edge suggests confirmation should come from price action around $800 and $830–$850 rather than relying on momentum alone.
Putting It All Together: Next Week’s Focus
Our base case is a controlled, trend-consistent week featuring support tests near $800–$786 and attempted pushes into $830–$850. As long as the SMA20 continues to act as a floor on closing bases, risk/reward tends to favor dip-buying against that average. A decisive daily close above $850 would aim the tape toward $880 and put the psychological $900 figure on watch. Conversely, a daily close below $786 followed by failure to quickly reclaim it would open room to $760 and potentially the SMA50 near $723.33.
Traders attuned to momentum should monitor whether RSI pushes toward 70 in concert with a widening positive MACD histogram. That tandem would validate upside follow-through. Absent that, anticipate rotational behavior with range development around the moving averages.
Editorial Statement (Disclaimer)
This weekly note is a technical analysis commentary based solely on the provided snapshot data (price: $816.25; SMA20: $785.79; SMA50: $723.33; RSI(14): 64.87; MACD 12/26/9: 19.45 vs. 19.36) and the cited external articles for contextual references to historical levels and long-term narratives. It does not incorporate any undisclosed fundamental information or real-time order book data. The scenarios and levels discussed are analytical frameworks, not financial advice or forward-looking guarantees. Markets are volatile; prices can move rapidly and surpass technical thresholds, especially around news or liquidity shocks. Always perform your own due diligence, consider multiple perspectives, and use risk controls appropriate to your objectives and constraints.
SEO Title: BNB-USD Weekly Technical Analysis: Price $816.25, RSI 64.87, Above SMA20/50
SEO Meta Description: BNB-USD weekly technical: price $816.25 (+8.13% w/w), RSI 64.87, MACD marginally bullish, price above SMA20/50. Key levels, scenarios, and risk outlook.