TRX-USD Weekly Technical Analysis: Momentum Presses $0.35–$0.36 as RSI Stretches; Cautious Bullish Bias into Next Week
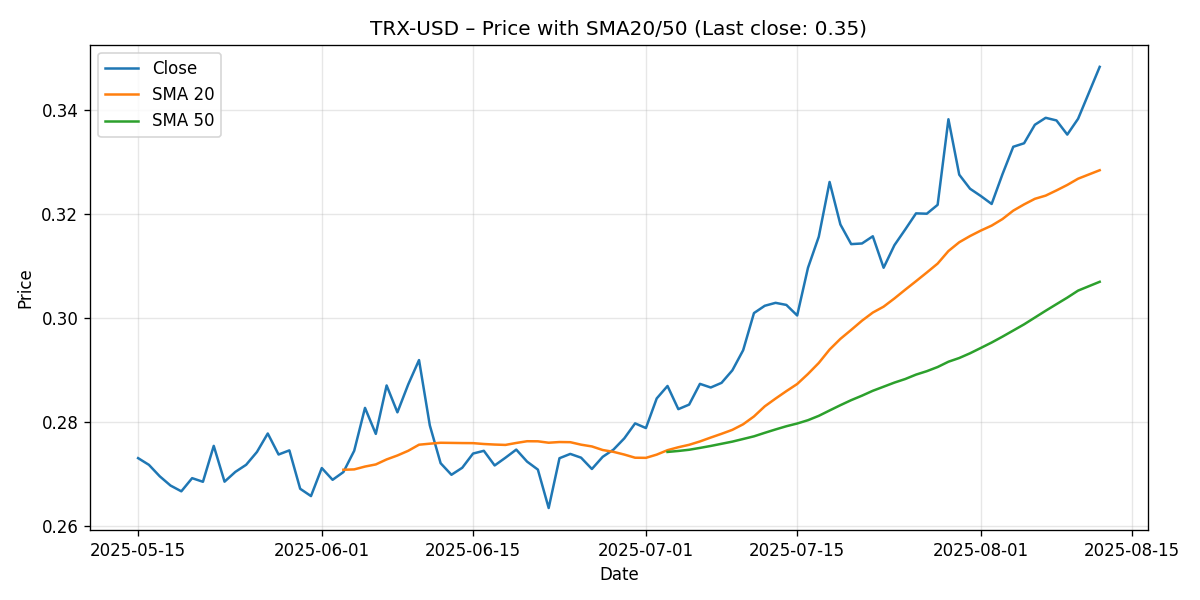
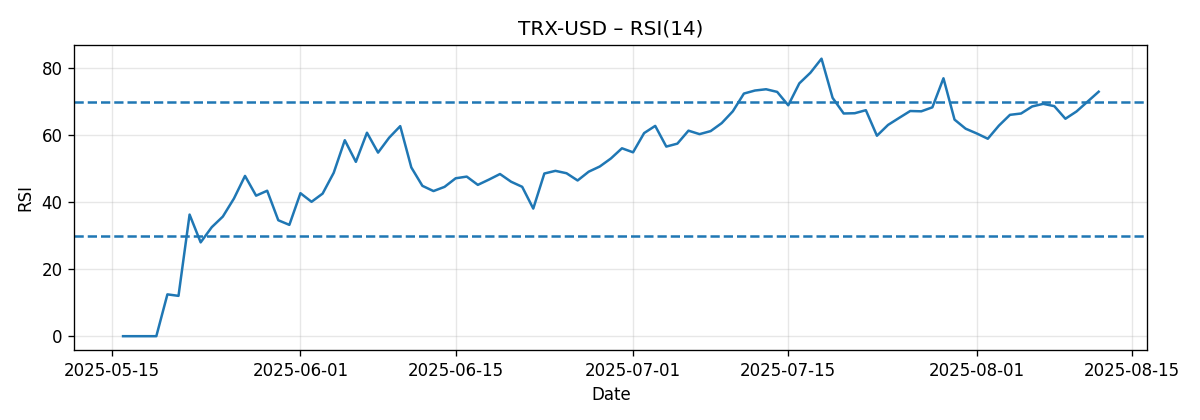
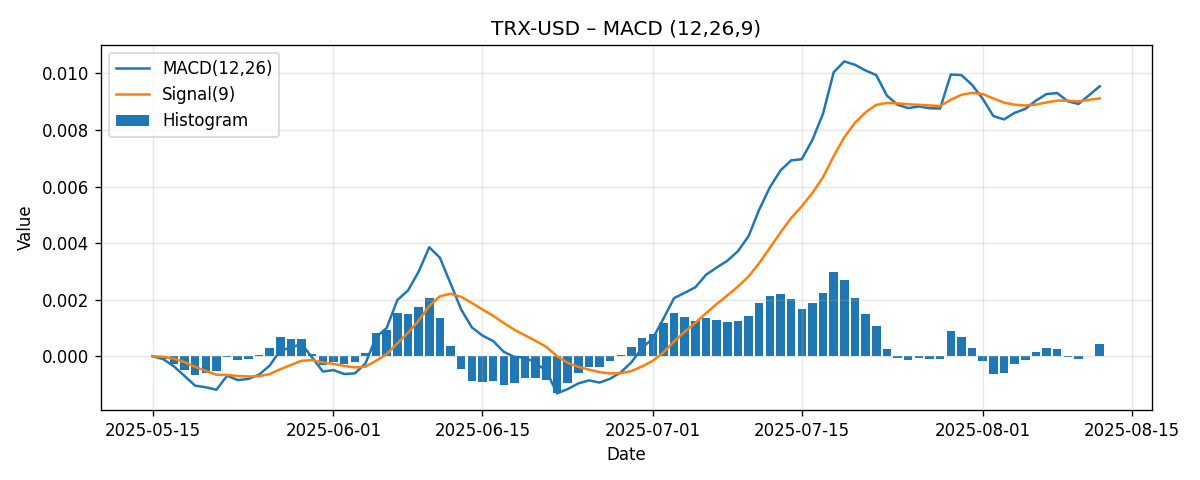
As of the latest seven-day snapshot (generated 2025-08-12 15:23 UTC), TRX-USD closed at $0.3483, finishing the week up 4.40%. The spot price sits comfortably above its 20-day and 50-day simple moving averages (SMA20 ≈ $0.3284; SMA50 ≈ $0.3070), while momentum readings are mixed-to-positive: the 14-period RSI is elevated at 72.97 (overbought territory), and MACD (12,26,9) is modestly positive with the MACD line at 0.00954 versus a signal line at 0.00912.
Executive Summary
TRX-USD’s weekly performance reflects constructive momentum within a short-term uptrend, but it is accompanied by stretched conditions on the RSI. Price is trading:
- Approximately 6.0% above the 20-day SMA (price ≈ $0.3483 vs. SMA20 ≈ $0.3284).
- Roughly 13.5% above the 50-day SMA (price ≈ $0.3483 vs. SMA50 ≈ $0.3070).
The MACD line nudging above its signal line suggests incremental bullish momentum. However, with RSI near 73, the market is prone to near-term digestion: a pause, sideways consolidation, or a pullback toward the 20-day average would be typical after such a run.
Key takeaways:
- Trend: Short-term uptrend intact with price above both SMA20 and SMA50.
- Momentum: Positive but shallow; MACD histogram is only marginally positive, signaling a trend that could accelerate on a clean breakout—or fade if buyers tire.
- Overbought signal: RSI at 72.97 raises the odds of mean reversion unless upside continuation is strong enough to keep momentum aloft.
- Levels to watch: $0.35 (round-number friction), $0.36 (externally cited breakout threshold), $0.328–$0.33 (SMA20 and a nearby psychological zone), and $0.307 (SMA50).
Base case into next week: A cautiously bullish stance with a bias for range-bound trade between $0.33 and $0.37 unless $0.36 breaks decisively. Upside clearance above $0.36 could open $0.38–$0.40; failure to hold $0.33–$0.328 risks a retrace toward the 50-day average near $0.307.
Weekly Market Context & Trend
TRX added 4.40% this past week, a respectable gain that positions price above both the 20-day and 50-day moving averages. This alignment typically indicates a constructive short-term trend. While we cannot infer the slopes of the moving averages from the snapshot, the fact that price is above both is a straightforward, objective checkmark in favor of bulls.
At the same time, momentum’s character matters: the MACD line’s slight premium to its signal line indicates buyers still have an edge, but the edge is narrow. This often happens at inflection points where a market either breaks higher with fresh demand or stalls as late buyers meet profit-taking.
The elevated RSI around 73 is the counterweight. Overbought readings do not automatically mean “sell”—they can persist in powerful trends—but they do raise the probability of shallow pullbacks or sideways resets before further extension. A healthy consolidation above the SMA20 would keep the trend intact while letting the RSI cool.
In short, context is moderately bullish, but the market appears to be approaching a decision zone where follow-through buying must validate the move or give way to a brief reset.
Detailed Technicals (Price + SMA20/50, RSI14, MACD 12/26/9)
Price versus Key Moving Averages
- Last close (TRX-USD): $0.3483
- SMA20: $0.3284 (price is ≈ $0.0199 above, or ≈ +6.0%)
- SMA50: $0.3070 (price is ≈ $0.0413 above, or ≈ +13.5%)
Interpretation:
- Positioning above the 20-day and 50-day averages confirms a near-term uptrend structure.
- The spacing from SMA20 to price is moderate, but not extreme; it can be worked off by either drifting sideways or small pullbacks that keep the 20-day average nearby.
- The larger gap to the 50-day average underscores broader trend improvement, yet also highlights room for a mean-reversion test if momentum wanes.
In practice, the 20-day average ($0.3284) often serves as a trend “guide rail” in trending phases. If price uses it as support on dips, buyers remain in control. A firm break below it does not automatically end the trend but would warn of a deeper test toward the 50-day average ($0.3070).
RSI(14): Overbought but Not Exhausted
- RSI(14): 72.97
An RSI above 70 is typically labeled “overbought.” That description captures risk, not destiny. In strong uptrends, RSI can hover above 70 for longer than expected as price stair-steps higher. The key is how price behaves on minor dips:
- If pullbacks are shallow and bought quickly, RSI can remain elevated without leading to major reversals.
- If RSI rolls lower in tandem with price slipping through the 20-day average, it increases the odds of testing deeper supports (e.g., toward the 50-day average).
Given the current reading, a prudent assumption for next week is either digestion between $0.33 and $0.36 or continuation only if bids are strong enough to clear resistance decisively. Watching whether RSI cools into the mid-60s on consolidation—or stretches further above 70 on a breakout—will be informative.
MACD (12, 26, 9): Slightly Positive Momentum
- MACD line: 0.00954
- Signal line: 0.00912
- Histogram (approx.): +0.00043
The MACD line sits modestly above its signal line, indicating a slight bullish bias. The histogram’s small positive value suggests momentum is positive but not emphatic. Such shallow differentials can flip quickly on minor price setbacks, which is why confluence with other signals (e.g., price retention above SMA20) is important.
In combination with the elevated RSI, MACD’s gentle positivity argues for a “cautiously optimistic” posture: upside is viable if resistance gives way, but momentum needs sustained buying to avoid fading.
Key Levels (Support/Resistance)
The following levels are derived from the provided snapshot and externally cited thresholds. Where prior highs/lows are not available from the snapshot, we reference moving averages and common psychological increments.
| Level | Type | Rationale |
|---|---|---|
| $0.35 | Resistance | Immediate round-number friction just above last close ($0.3483); often acts as a short-term decision point. |
| $0.36 | Resistance | Externally cited breakout threshold; aligns with Brave New Coin commentary pointing to a $0.36–$0.45 breakout zone. |
| $0.38 | Resistance | Intermediate psychological step-up; plausible near-term objective if $0.36 clears with momentum. |
| $0.40 | Resistance | Major round number; tends to attract profit-taking and optionality hedging in trending tapes. |
| $0.45 | Resistance | Upper end of the externally referenced $0.36–$0.45 breakout outlook; see Brave New Coin. |
| $0.34 | Support | Near-term psychological shelf below spot; helpful for gauging initial dip-buying interest. |
| $0.33 | Support | Round-number support that often stabilizes pullbacks in the absence of nearby historical pivots in the snapshot. |
| $0.3284 | Support | SMA20 from the snapshot; first structural support in the current trend framework. |
| $0.31 | Support | Psychological buffer above the 50-day average; used by some as a pre-50-day risk marker. |
| $0.3070 | Support | SMA50 from the snapshot; deeper trend support if sellers gain traction. |
Scenario Analysis (Next Week)
The following scenarios use objective markers from the snapshot and externally cited thresholds to frame potential paths. Ranges are approximations for the next 5–7 trading days, contingent on triggers.
1) Bullish Scenario
- Trigger: A daily close above $0.36 or a clear intraday breakout with follow-through buying.
- Momentum context: MACD stays positive; RSI may remain elevated but need not fall if price trends smoothly.
- Projection: $0.37–$0.40
Rationale: Clearing $0.36 would align the local tape with externally cited breakout context and signal that buyers can absorb supply near round numbers. With price already above SMA20 and SMA50, a transition toward the $0.38–$0.40 band becomes feasible if momentum expands.
2) Bearish Scenario
- Trigger: Failure to hold above $0.33, followed by a daily close below the SMA20 (~$0.3284).
- Momentum context: MACD flips or compresses toward flat; RSI rolls down from overbought into the 50–60 zone.
- Projection: $0.31–$0.33, with risk of probing the SMA50 around $0.307 should selling persist.
Rationale: Overbought conditions often correct through time (sideways) or price (down). A decisive breach of the 20-day average after losing $0.33 would shift tone from “consolidation” to “deeper mean reversion,” placing the 50-day average back in the market’s sights.
3) Most-Likely Scenario (Base Case)
- Trigger: Neither a clean breakout above $0.36 nor a breakdown below $0.33; price oscillates near current levels.
- Momentum context: MACD remains marginally positive; RSI cools modestly without breaking the overall trend.
- Projection: $0.33–$0.37
Rationale: With RSI already stretched and MACD only modestly positive, the market may need time to consolidate gains. A range-trade outcome that respects SMA20 support and tests $0.35–$0.36 from below would be a constructive digestion of recent strength.
Comparative Outlook: External Predictions and Our View
We benchmark our analysis against three external references to triangulate the near-term outlook.
1) Investing.com TRX USD Technical Analysis
Investing.com — TRX USD Technical Analysis summarizes the setup as “Summary: Neutral.”
Assessment versus snapshot: A neutral composite reading is consistent with our interpretation of a cautiously bullish trend facing overbought conditions. Our snapshot shows:
- Price above both SMA20 and SMA50 (a bullish structural sign).
- RSI at 72.97 (overbought), which can temper the immediate impulse to chase.
- MACD only slightly positive, implying momentum is present but tentative.
Why our view is only slightly more constructive: We lean “cautiously bullish” because the trend filters (price > SMA20 & SMA50) are clear, and the MACD is positive. However, we refrain from a full-bull stance due to the stretched RSI. In effect, we align with the neutral summary in spirit, but we ascribe a modest probability premium to upside continuation via $0.36 if buyers persist.
2) FXEmpire: Descending Channel Breakout
FXEmpire notes: “Descending channel breakout suggests bullish continuation.”
Assessment versus snapshot: The snapshot corroborates bullish continuation risk with price above SMA20/SMA50 and a positive MACD. RSI’s overbought reading, however, reminds us that breakouts often retest before trending; the path may not be linear. We are directionally aligned with the FXEmpire takeaway but temper expectations with next-week ranges, highlighting the importance of $0.36 to validate momentum.
3) Brave New Coin: $0.36–$0.45 Breakout Outlook
Brave New Coin frames the technical outlook as a “classic cup and handle setup playing out on the daily chart,” with a “$0.36–$0.45 breakout outlook.”
Assessment versus snapshot: Our data-driven levels place $0.36 as a pivotal resistance, making the BNC range a logical extension if a breakout materializes. Given the current RSI near 73, we consider a near-term consolidation equally plausible before any sustained push toward the upper band ($0.40–$0.45). Thus, we partially align with the bullish thesis while emphasizing the need for confirmation through $0.36 and sustained momentum (i.e., MACD widening positive).
What to Watch Next Week
- Behavior near $0.35–$0.36: Quick rejection would favor consolidation; acceptance and closing strength above $0.36 would set $0.38–$0.40 into view.
- Support retests at $0.33–$0.328 (SMA20): Holding these zones with improving breadth would signal healthy digestion; losing them shifts focus toward $0.31–$0.307 (SMA50).
- RSI reaction: A drift from ~73 toward the mid-60s on sideway trade is healthy; a sharp drop accompanying a loss of SMA20 would warn that momentum is reversing.
- MACD histogram: Expanding positive bars would confirm upside energy; flattening or turning negative would foreshadow a cooling phase.
Risk Factors & What Could Invalidate The Setups
- Momentum whipsaw risk: With a small MACD-signal spread, minor price swings can flip the signal quickly, leading to false starts above or below key levels.
- Overbought resolution path: RSI near 73 could resolve via time (sideways chop) or price (pullback). A price-led resolution can be abrupt, especially if $0.33 and the SMA20 give way, dragging price toward $0.31–$0.307.
- Correlation shocks: Crypto markets often move as a complex; wider-market risk-on/risk-off waves can overwhelm otherwise sound setups.
- Headline sensitivity: Project- or ecosystem-specific developments, exchange news, or regulatory signals can trigger outsized moves that invalidate technical parameters rapidly.
- Liquidity and gap risk: Thin conditions during off-peak hours can amplify moves around round numbers and moving averages, distorting signals and risk levels.
- Expectation overshoot: If a breakout above $0.36 fails to see follow-through, a bull trap could form, forcing a fast return into the prior range and pressuring SMA20.
Positioning Notes and Tactics (Non-Advice)
While we do not provide individualized advice, the following general technical considerations may be relevant for traders who rely on similar toolkits:
- Trend-followers often prefer to see sustained closes above resistance (here, $0.36) before expecting targets like $0.38–$0.40.
- Mean-reversion approaches may favor patiently waiting for dips toward SMA20 ($0.3284) when RSI is overbought, provided the broader trend remains intact.
- Risk management tends to tighten when RSI is elevated; partial scaling or hedging into resistance zones is common among momentum strategies.
These are broad observations; actual decisions should reflect one’s personal risk tolerance, time horizon, and broader portfolio context.
Bottom Line
TRX-USD closed the week at $0.3483, up 4.40% with price sitting above both the 20-day and 50-day moving averages. The RSI at 72.97 signals a stretched state, and MACD is marginally positive. This mix suggests a cautiously bullish stance: the trend backdrop is favorable, but the market is at a spot where confirmation is needed. A convincing break and hold above $0.36 unlocks $0.38–$0.40; otherwise, expect consolidation between $0.33 and $0.37, with the 20-day average ($0.3284) the first meaningful support and the 50-day average ($0.3070) the deeper line in the sand if sellers press.
Editorial Statement
This analysis is provided for informational and educational purposes only and reflects a technical perspective based solely on the supplied snapshot and the cited external commentaries. It is not investment advice, an offer, or a solicitation to buy or sell any asset. Digital assets are volatile and may not be suitable for all investors. Past performance and technical patterns do not guarantee future results. Always conduct your own research and consider consulting a qualified financial professional before making trading or investment decisions.