USD/JPY Weekly Technical Analysis (Week Ending 16 Aug 2025):
Executive Summary
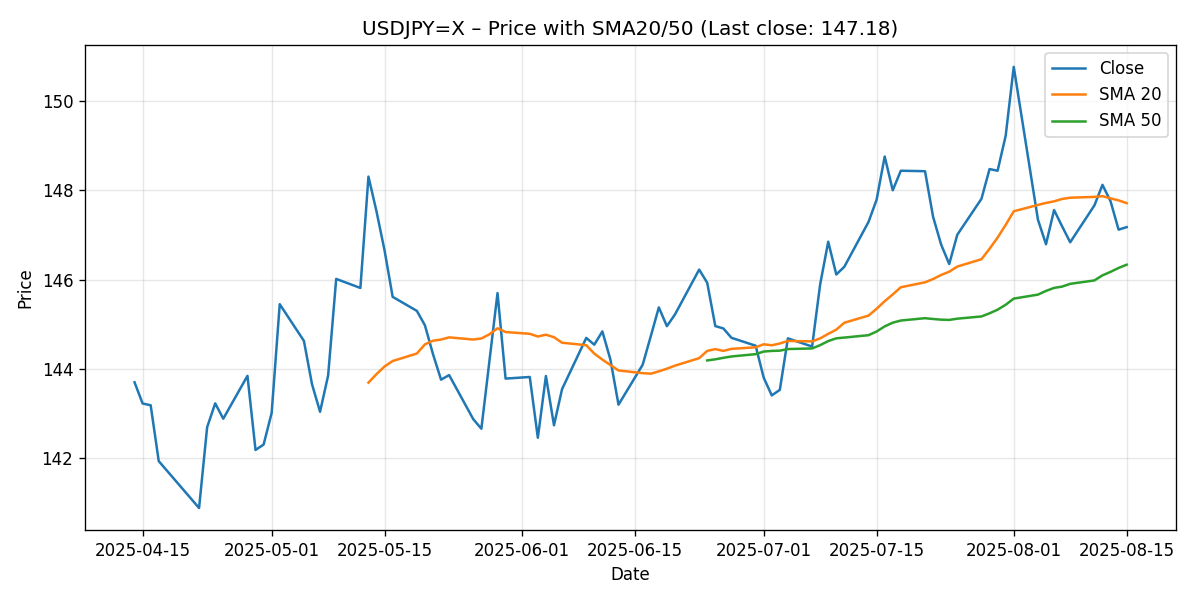
USD/JPY closed the week at 147.177, down about 1.09% week-on-week based on the provided seven-day snapshot. Price sits below the 20-day simple moving average (SMA20 at 147.714) but remains above the 50-day simple moving average (SMA50 at 146.334). That positioning — sandwiched between the two key averages — frames a neutral-to-slightly-bearish short-term bias within a still-intact broader uptrend structure. Momentum readings corroborate the stalemate: the 14-period RSI is essentially neutral at 49.47 (near the midpoint of its oscillation range), while the MACD line (12/26/9) is modestly positive at 0.255 but below its signal line at 0.447, indicating softening momentum despite a still-positive baseline.
The market’s focal area is tightening into a 146.00–148.15 tactical band defined by external technical calls and the moving averages:
- Near-term resistance: 148.15 (as highlighted by OANDA MarketPulse: “Bearish below 148.15”).
- Immediate pivot: SMA20 at 147.714, which price failed to hold this week.
- Near-term supports: 146.60 (MarketPulse), 146.33 (SMA50), and 146.00 (MUFG’s “next important support”).
Beyond that local band, OANDA’s monthly tactical view flags 151.30 as a key medium-term pivotal resistance, while sub-146 breaks can expose the 145.95/145.85 area and potentially the medium-term range support at 144.50 (per OANDA and MarketPulse). Our base case for the coming week is a continuation of range trade between 146.60 and 148.15, with reactive pushes toward 146.00 on downside probes and toward 147.70/148.15 on rallies. A decisive break above 148.15 would tilt momentum back to the upside and re-open 148.15 to 151.30 over a multi-session horizon; conversely, a break below 146.00 would strengthen bearish pressure toward 145.95/145.85 and, if extended, 144.50.
Weekly Market Context & Trend
The seven-day snapshot shows USD/JPY declining by approximately 1.09%, closing the week at 147.177. In practical terms, this week’s pullback nudged spot below its SMA20, signaling that the short-term rhythm has softened. However, the pair still holds above the SMA50 (146.334), implying the broader directional bias remains supported — albeit with momentum ebbing. This type of configuration frequently precedes either a fresh attempt to reclaim the 20-day average (if buyers reassert control) or a retest of the 50-day average and adjacent supports (if sellers remain engaged).
The technical context is nuanced rather than outright directional:
- Price vs. SMA20: Closing below the 20-DMA suggests the immediate upside impulse has faded. In many trend-following frameworks, the 20-DMA operates as a fast-moving proxy for short-term trend. Slipping under it often precedes consolidation or a corrective phase.
- Price vs. SMA50: Holding above the 50-DMA implies the intermediate trend remains constructive. The 50-DMA commonly anchors swing-trend bias in many technical playbooks; as long as price respects it, downside impulses are interpreted as pullbacks rather than full trend reversals.
- Neutral momentum: An RSI near 50 and MACD above zero but below signal line collectively underscore indecision — neither a completed bearish transition nor a robust bullish impulse.
External technical commentary supports a range-centric framework. MUFG Research states, “The next important support level for the pair comes in at around the 146.00-level.” OANDA’s monthly tactical view points to a pivotal resistance at 151.30 and warns that “a break below 145.95 may expose the medium-term ascending range support of 144.50.” OANDA MarketPulse frames tactical bias as “Bearish below 148.15; a break under 146.60 may expose 145.85 then 144.50.” Together, these references set a series of handrails that align cleanly with the moving-average posture observed in the data.
Detailed Technicals
Price Action and Moving Averages (SMA20/50)
Closing price: 147.177
- SMA20: 147.714
- SMA50: 146.334
Interpretation:
- Sub-SMA20 suggests short-term momentum softened. The market tried and failed to sustain above the near-term trend gauge, reflecting selling interest on rallies.
- Above-SMA50 indicates the intermediate trend structure remains intact. As long as price does not violate the 50-DMA with authority, pullbacks often morph into range-trading rather than trend reversals.
- The stack — SMA20 above SMA50 — typically denotes that the medium-term bullish structure has not broken, even if near-term pressure persists. In other words, the broader bias can remain constructive while the short-term timeframe consolidates or corrects.
Implication for the coming week: The SMA20 at 147.714 is a nearby pivot that bulls will want to reclaim early in the week to rebuild upside momentum. Failure to do so keeps pressure toward 146.60 and 146.00 (external supports). The SMA50 at 146.334 is likely to act as first dynamic support if sellers push lower.
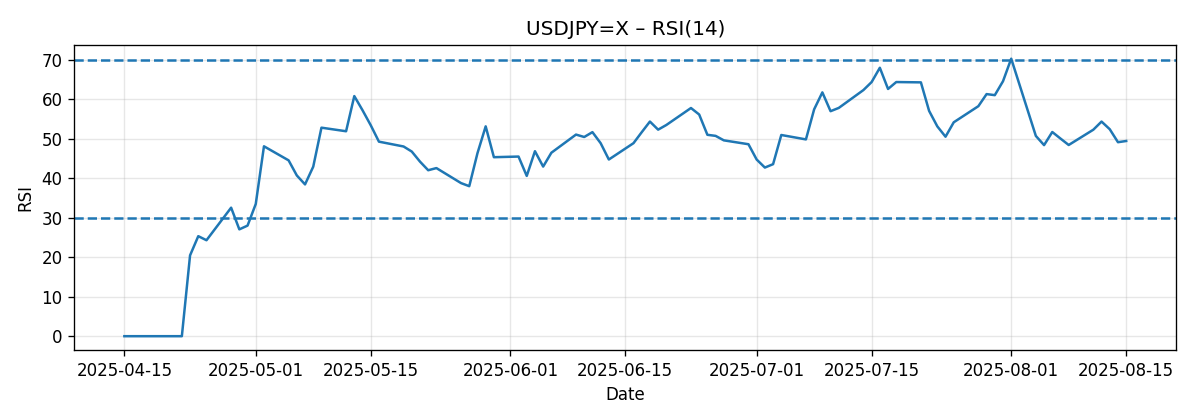
RSI (14)
RSI14: 49.47
The RSI is sitting basically at the center of its range, consistent with a market that is neither stretched nor trending decisively. In practical terms, a mid-40s to low-50s RSI often coincides with sideways trade, choppy responses to news flow, and a focus on local support/resistance rather than trend continuation signals. Traders typically shift emphasis to level-driven tactics — buying dips into known supports and fading rallies into nearby resistances — until RSI resolves with a sustained push toward either end of its spectrum.
Setups informed by RSI at these levels:
- Mean-reversion bias tends to dominate. Entries are often based on tests of moving averages or horizontal levels rather than momentum breakouts.
- A persistence near the midpoint can keep the pair inside a 146.00–148.15 tactical corridor, unless a decisive catalyst forces a break.
- A sustained shift away from the midpoint (combined with price acceptance beyond moving averages) would be needed to reassert a directional impulse.
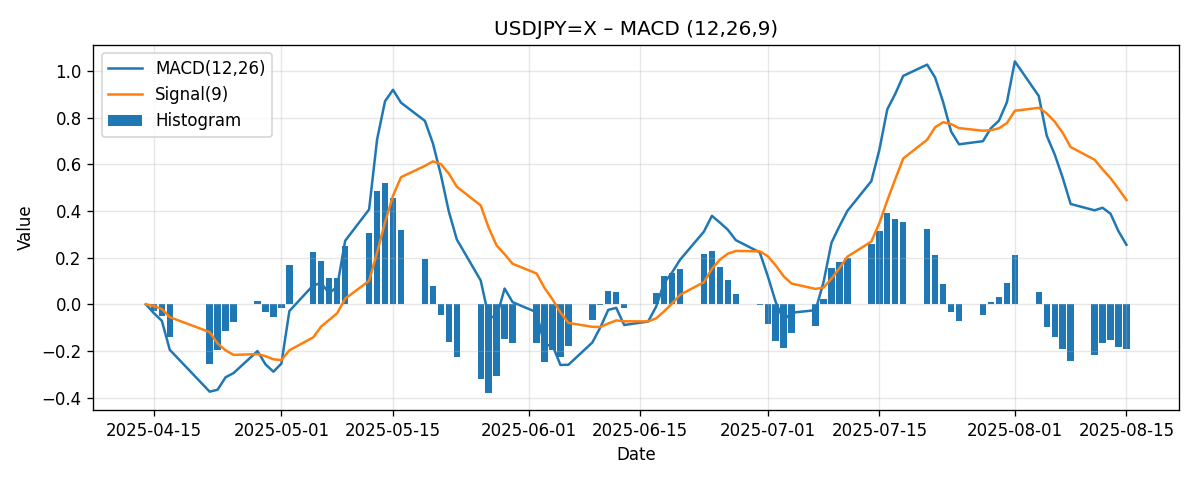
MACD (12/26/9)
MACD line: 0.255; Signal line: 0.447
The MACD remains positive but is below its signal line, producing a negative histogram. This configuration reflects fading upside momentum rather than outright bearishness. In many trading systems, the “MACD-above-zero but below-signal” state aligns with consolidation or early-stage corrective phases inside a broader uptrend backdrop. Often, price will chop while the MACD attempts to reset; subsequent direction then depends on whether the MACD turns up (bullish re-acceleration) or dips below zero (broader momentum transition).
What to watch next week:
- If price reclaims and holds above the SMA20, the MACD could curl higher and reduce the signal gap, improving bullish odds back toward 148.15 and beyond.
- If price is rejected by the SMA20 and slips toward the SMA50/146.60 zone, MACD may continue to soften, increasing the risk of a deeper test into 146.00/145.95.
Key Levels (Support/Resistance)
The table below consolidates actionable levels derived from the provided data snapshot and three external technical outlooks. Levels are organized as supports, resistances, and pivots, with rationale and implications.
| Level | Type | Rationale / Source | Relative Strength | Trading Implication |
|---|---|---|---|---|
| 151.30 | Resistance | Key medium-term pivotal resistance (OANDA Monthly Tactical View) | High | Major cap; a sustained break would re-open higher medium-term ranges. |
| 148.15 | Resistance | “Bearish below 148.15” (OANDA MarketPulse) | Medium | Near-term lid; reclaiming above would improve bullish momentum. |
| 147.714 | Pivot / Dynamic | SMA20 (snapshot) | Medium | Short-term trend gauge; acceptance above/below sets intraday bias. |
| 147.177 | Spot reference | Weekly close (snapshot) | — | Benchmark for early-week gap/risk assessment and reference anchoring. |
| 146.60 | Support | Break under 146.60 may expose 145.85 (OANDA MarketPulse) | Medium | First horizontal support below spot; loss invites deeper tests. |
| 146.334 | Support / Dynamic | SMA50 (snapshot) | Medium | Intermediate trend backbone; often attracts dip buyers initially. |
| 146.00 | Support | “Next important support … around 146.00” (MUFG Research) | High (near-term) | Key defense; a decisive breach would embolden bears. |
| 145.95 | Support | Break below 145.95 may expose 144.50 (OANDA Monthly Tactical View) | High (trigger) | Gateway toward medium-term range support if lost. |
| 145.85 | Support | 145.85 next after 146.60 (OANDA MarketPulse) | Medium | Intermediate shelf between 146.00 and 144.50. |
| 144.50 | Support | Medium-term ascending range support (OANDA Monthly Tactical View; MarketPulse) | High (structural) | Major range floor; typically a strong reaction zone if tested. |
Scenario Analysis: Next-Week Pathways and Ranges
Given the neutral momentum and the clustering of levels, the most useful framework for the coming week is scenario-based. The following projections lean explicitly on the levels highlighted in the data and the three external sources.
1) Bullish Scenario (Rebuild Above SMA20 and 148.15)
Trigger: Early-week stability above 147.71 (SMA20) followed by a sustained push through 148.15.
- Set-up logic: Reclaiming the 20-DMA would telegraph that buyers have absorbed recent supply. Clearing 148.15 (per MarketPulse’s “bearish below 148.15” qualifier) would neutralize the short-term bearish tone and encourage momentum traders.
- Projected next-week range: 148.15 to 149.00 on initial extension, with risk of a further stretch toward 150.00 only if momentum accelerates; however, the medium-term resistance magnet remains 151.30 (OANDA). For the immediate week, we constrain the focus to 148.15–149.00, acknowledging that 149.00–151.30 lies beyond the first resistance band and likely requires additional catalysts.
- Validation: RSI lifting away from the midpoint and the MACD narrowing its negative gap to the signal line would support the move.
- Invalidation: A daily failure back below 147.71 after an initial breakout attempt, especially if followed by a slip under 147.20 (spot reference), would undermine the scenario.
2) Bearish Scenario (Failure at SMA20, Loss of 146.60/146.33)
Trigger: Rejection at or below 147.71 (SMA20) followed by a break beneath 146.60 and the SMA50 at 146.33.
- Set-up logic: Persistent inability to reclaim the SMA20 would keep the burden of proof on bulls. Losing 146.60 (MarketPulse) and 146.33 (SMA50) would mark an escalation, opening the path toward the 146.00 level highlighted by MUFG.
- Projected next-week range: 145.85 to 147.00 after a break of 146.60/146.33, with the lower bound reflecting the next cited support (MarketPulse). A more extended bearish swing could probe 145.95/145.85 and potentially 144.50, but we limit the primary weekly range to 145.85–147.00 unless 146.00 is decisively lost early.
- Validation: RSI drifting below the midpoint, plus the MACD sliding further beneath its signal and toward zero, would confirm weakening momentum.
- Invalidation: A swift reclaim of 147.71 followed by acceptance above 148.15 would neutralize the bearish scenario.
3) Most-Likely Scenario (Range Continuation)
Trigger: No decisive break of 148.15 on the topside or 146.60 on the downside; price oscillates around moving-average pivots.
- Set-up logic: With RSI centered and MACD softening but still positive, conditions favor stabilization and range-trading until a forceful directional catalyst emerges. The SMA20 and SMA50 boundaries can serve as intraday anchors.
- Projected next-week range: 146.60 to 148.15, using MarketPulse’s near-term guardrails and the SMA20 as a mid-range pivot. Within that band, 147.71 (SMA20) functions as the tactical dividing line for intraday bias.
- Validation: Continuation of neutral RSI readings and lack of expansion in MACD momentum; repeated rejections at 148.15 and support catches near 146.60/146.33.
- Invalidation: A decisive close above 148.15 or below 146.60 that holds into the following session.
Comparative Outlook: How Our View Aligns or Differs from External Calls
We compare our base case and key levels against three provided external outlooks. The goal is to reconcile differences and highlight where our emphasis may diverge given the latest snapshot readings.
1) MUFG Research (FX Weekly)
Source: MUFG Research — FX Weekly
“The next important support level for the pair comes in at around the 146.00-level.”
Alignment: We treat 146.00 as a pivotal support that, if lost, could embolden bears and increase the probability of tests into the 145.95/145.85 zone referenced by OANDA sources. The proximity of 146.00 to the SMA50 (146.334) and the MarketPulse 146.60 threshold builds a layered support cluster between 146.60 and 146.00. In our base-case range scenario (146.60–148.15), 146.00 acts as the boundary that would shift the weekly tone from neutral to bearish if decisively broken.
Differentiation: Our view adds a dynamic component via the moving averages. We monitor 146.33 (SMA50) just above MUFG’s 146.00 line; a break of SMA50 tends to precede a test of static horizontal supports like 146.00. Practically, we would expect sellers to attempt a staged progression: first 146.60, then 146.33, and only then 146.00. The layered approach helps manage risk around false breaks.
2) OANDA — Monthly Tactical View (August)
Source: OANDA — Monthly Tactical View (August)
“Watch the 151.30 key medium-term pivotal resistance; a break below 145.95 may expose the medium-term ascending range support of 144.50.”
Alignment: We adopt 151.30 as the next major resistance in the event the pair re-establishes a bullish trajectory. On the downside, we acknowledge that a break below the mid-145s would place 144.50 — a medium-term ascending range support — in focus. Our scenarios remain conservative for the immediate week (given neutral momentum and the 20/50-DMA posture), but we treat 151.30 and 144.50 as strategic waypoints for medium-term traders.
Differentiation: Our near-term focus is narrower: 146.60–148.15 as a tactical range guided by momentum conditions that currently look neutral. While OANDA’s monthly lens spans a broader horizon, we integrate those levels as “what’s next if” magnets rather than immediate weekly targets. In short, we agree on the structural landmarks but expect the market to resolve the 146.00–148.15 neighborhood first.
3) OANDA MarketPulse — USD/JPY Technical
Source: OANDA MarketPulse — USD/JPY Technical
“Bearish below 148.15; a break under 146.60 may expose 145.85 then 144.50.”
Alignment: This framework maps well onto the price’s current stance under the SMA20 and just above layered supports. We agree that 148.15 needs to be reclaimed to improve the immediate bullish narrative. Conversely, a slip through 146.60 sets up 145.85 and, in extension, 144.50.
Differentiation: Our analysis overlays these MarketPulse thresholds with the moving averages and RSI/MACD posture to infer probabilities. With RSI neutral and MACD soft, we give the “range-hold” scenario slightly higher odds for the coming week, favoring 146.60–148.15 rather than an immediate directional break. Still, we acknowledge that momentum shifts can happen quickly; hence our risk section emphasizes preparation for a vol expansion once either boundary gives way.
Risk Factors & What Could Invalidate the Setups
While our scenarios are derived from observable technicals and externally cited levels, any trading plan must accommodate uncertainty. The following risk vectors can disrupt range dynamics or accelerate breakouts/breakdowns:
- Volatility spikes around macro headlines: Unexpected developments or sentiment shocks often create gap risks that skip intermediate levels. In such cases, price can jump from above 148.15 to mid-149s or break cleanly below 146.00 and land near 145.85/145.95 levels with limited retracement.
- Liquidity conditions: Thin liquidity can exaggerate moves around well-watched levels like 146.60, 146.00, and 148.15. False breaks — quick pierces that reverse — are common under such conditions.
- Inter-market feedback loops: Correlated asset moves can influence USD/JPY flows. Rapid shifts in risk appetite can trigger synchronized FX adjustments independent of the pair’s isolated technicals.
- Technical clustering and orders: Because multiple sources flag the same bands (148.15 resistance; 146.60/146.00 support), stops may cluster around them. That tends to increase the speed of moves when these levels break, raising slippage risk.
Invalidation criteria for our scenarios:
- Range scenario invalidation: A decisive, sustained break and acceptance above 148.15 or below 146.60 — with momentum confirmation (RSI trend away from midpoint, MACD improving/deteriorating) — would invalidate the expectation of continued range trading.
- Bullish scenario invalidation: Failure to hold above SMA20 after a breakout attempt, especially if followed by a close back under 147.20 and pressure on 146.60/146.33.
- Bearish scenario invalidation: A swift recovery above SMA20 and then 148.15 would neutralize a breakdown that briefly dipped under 146.60.
Risk management thoughts (non-prescriptive):
- Consider staggered entries around levels with partial sizing to account for false breaks.
- Use the moving averages as dynamic filters; for instance, tolerance bands around SMA20 and SMA50 can help differentiate noise from genuine acceptance.
- Be mindful of slippage around widely publicized triggers (148.15, 146.60, 146.00), especially during illiquid times.
Putting It All Together: Tactics by Trader Type
Traders approach the same levels differently depending on horizon and methodology. With the current neutral momentum backdrop, here is how styles often adapt:
- Short-term mean reversion: Focus on fading moves into 148.15 resistance and buying dips into 146.60/146.33 support, with tight risk parameters and quick profit-taking near the SMA20 pivot.
- Breakout traders: Stand by for a confirmed push above 148.15 (for topside) or a sustained break below 146.60/146.33 (for downside). Confirmation might include multiple closes or momentum indicators turning decisively.
- Swing traders: Monitor 146.00 as a structural support per MUFG; a hold above it preserves potential for a medium-term push back toward 151.30. Conversely, a clean loss of 146.00 shifts focus down the ladder to 145.95/145.85 and, if pressure persists, 144.50.
In all cases, the converging signals — price beneath SMA20, above SMA50, neutral RSI, MACD soft but positive — argue for patience and responsiveness rather than prediction. Let the market tip its hand at the edges: 148.15 and 146.60/146.33 are the practical gates.
Why the Moving Averages Matter Right Now
Moving averages are not merely lines; they are proxies for participation and price memory. The SMA20 represents recent activity; when price is below it, recent buyers are underwater, often creating supply on rallies back into that average. The SMA50, with a longer lookback, smooths fluctuations and offers a sturdier gauge of the intermediate bias. This week’s alignment — price below SMA20 but above SMA50, and SMA20 above SMA50 — is classic consolidation inside a broader uptrend. Monitoring how price interacts with these lines helps discriminate between a benign pullback and a transition into a broader downswing.
Moreover, the proximity of static levels to dynamic averages increases their salience. The 146.60 static line (MarketPulse) sits near the SMA50 at 146.33. That proximity creates a high-interest congestion zone where both systematic and discretionary strategies often engage. If price breaks through that zone decisively, the path of least resistance widens toward 146.00 and potentially 145.95/145.85. Conversely, a strong bounce off this composite area can propel price back to test the 147.71/148.15 band.
Momentum Diagnostics: Reading RSI and MACD Together
RSI and MACD convey different aspects of momentum. RSI is scale-bound and comparative — it reflects how strong recent gains are relative to losses. A reading near 50 suggests balance. MACD, by contrast, measures the spread between two exponential averages (12 and 26 periods) and compares it to its own 9-period signal, providing a sense of trend intensity and shifts in momentum.
In the current case, RSI at 49.47 and a MACD that is positive yet below its signal hint at a market pausing rather than reversing. A rising RSI from the midpoint, especially if accompanied by MACD flattening and curling higher, would support breakout attempts over 148.15. In contrast, RSI slipping lower with MACD approaching zero would warn that the consolidation is tilting bearish, elevating the risk of a breakdown through 146.60/146.33 toward 146.00.
Level-by-Level Playbook for the Week Ahead
Given the clustering of cited levels, a practical playbook can be summarized as follows:
- 148.15: First key resistance. Acceptance above it would mark a material improvement in short-term momentum, with 147.71 then repurposed as support on pullbacks. Above 148.15, the market can attempt higher ranges toward 149.00 and, if momentum persists, look to the broader 151.30 cap in the medium term.
- 147.71 (SMA20): Tactical pivot. Hovering below it maintains a cautious bias; reclaiming it is the initial step for bulls.
- 146.60 / 146.33 (SMA50): First major support band. Expect reaction here; a clean break is often more informative than the first touch.
- 146.00: Pivotal support per MUFG. A decisive loss materially weakens the case for a quick rebound and points toward 145.95/145.85.
- 145.95 / 145.85 and 144.50: Deeper supports per OANDA and MarketPulse. These become relevant contingencies if 146.00 fails.
Conclusion: A Measured Stance with Eyes on 148.15 and 146.60
USD/JPY’s weekly slip under the 20-DMA, while holding above the 50-DMA, frames a market in wait-and-see mode. Momentum is neutral, and external research condenses the tactical map: 148.15 caps rallies for now; 146.60/146.33 anchors first-line support; 146.00 is the pivotal bearish trigger; 151.30 and 144.50 remain medium-term bookends. Our most-likely path for the coming week is a continuation of the 146.60–148.15 range, with reactive trades at the edges. Be prepared, however, for a volatility expansion once either boundary breaks — and use the moving averages to filter noise from signal.
Editorial Statement
This analysis is provided for informational and educational purposes only and reflects the technical signals present in the supplied snapshot and the three cited external sources at the time of writing. It is not investment advice, an offer, or a solicitation to buy or sell any financial instrument. Trading foreign exchange involves risk, including the possible loss of principal. Always perform your own due diligence and consider your financial objectives and risk tolerance before making trading decisions. Past performance and historical patterns do not guarantee future results.