Dow Jones (^DJI) Weekly Technical Analysis:
Executive Summary
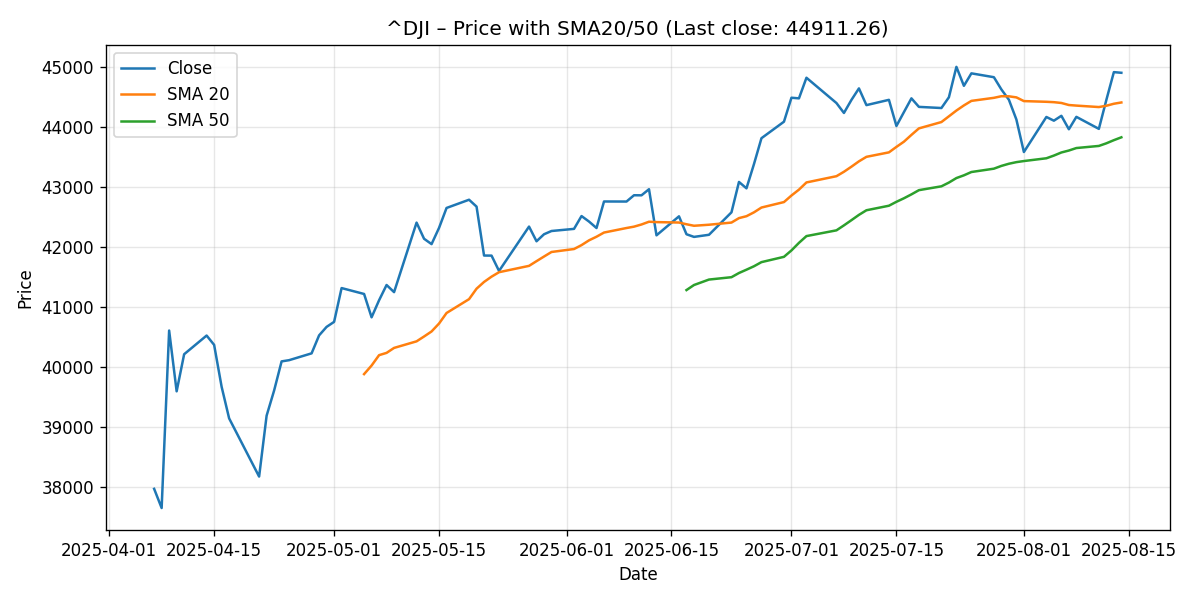
The Dow Jones Industrial Average (^DJI) advanced this week, closing at 44,911.26, up approximately 1.63% over the last seven-day window. The index now sits above both its 20-day and 50-day simple moving averages (SMAs), reinforcing a constructive near-term technical posture. Specifically, price is about 1.12% above the 20-day SMA (44,415.76) and 2.46% above the 50-day SMA (43,834.13). Momentum gauges are supportive but not overstretched: the 14-day RSI prints near 60.0, consistent with a bullish-but-not-overbought state, and MACD (12/26/9) remains above its signal line with a positive histogram of roughly +9.12, indicating incremental upside momentum.
Into next week, the market’s focal point is the psychological 45,000 round number directly overhead. Holding above the 20-day SMA (~44,416) would keep the short-term uptrend intact, while a decisive break below the 50-day SMA (~43,834) would undermine the current constructive bias. Our base case anticipates range-bound trade within a moderately bullish skew, provided momentum holds and dip-buyers defend the 20-day SMA on pullbacks.
- Last close: 44,911.26 (+1.63% w/w; approximately +721 points week-over-week by our estimate)
- SMA20: 44,415.76 (price ~1.12% above)
- SMA50: 43,834.13 (price ~2.46% above)
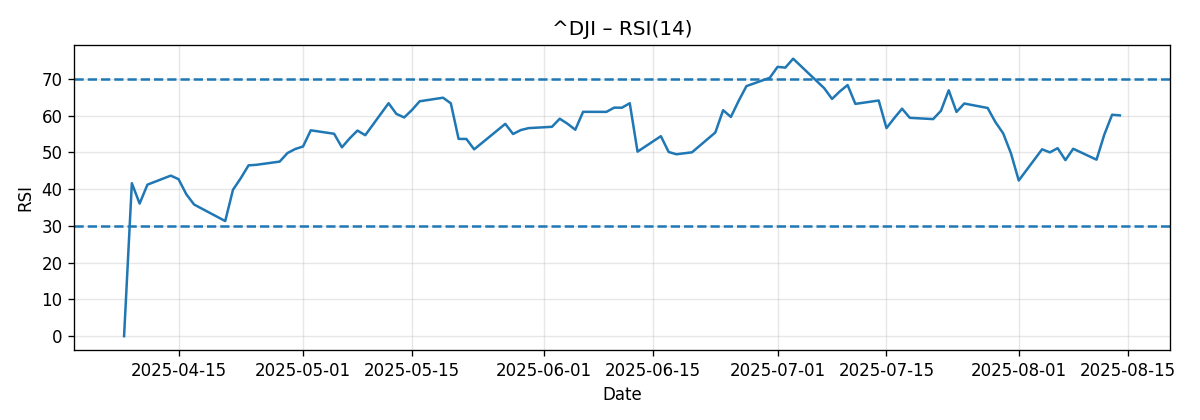
- RSI(14): ~60.0 (constructive, not overbought)
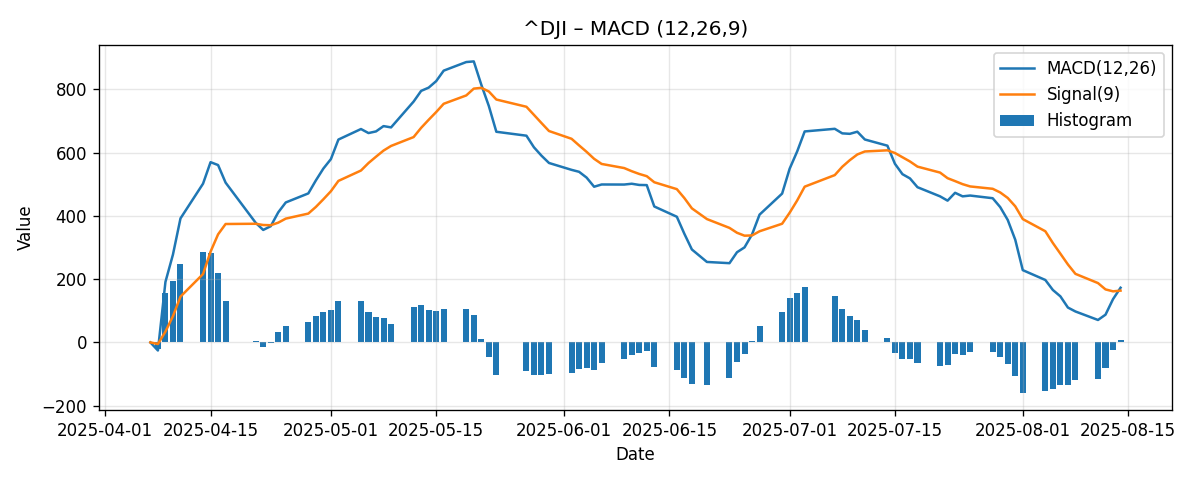
- MACD(12/26/9): 172.74 vs. Signal 163.62 (histogram ~+9.12)
- Key focal level: 45,000 (psychological round number; nearby resistance)
Weekly Market Context & Trend
The Dow’s 1.63% weekly gain puts the index back on the front foot after a prior period of mixed sentiment. The current technical picture tilts cautiously bullish for three reasons. First, price trades above the 20- and 50-day moving averages, a condition often associated with a short-term uptrend. Second, momentum is positive: RSI above 50 favors buyers, and MACD above its signal line implies improving trend confirmation. Third, the distance to the 20-day SMA is moderate, allowing room for garden-variety pullbacks without immediately threatening the uptrend’s integrity.
Despite these positives, the proximity of the 45,000 handle injects a near-term decision point. Round numbers often act as behavioral thresholds where supply can emerge, especially after a run-up. A clean break and hold above 45,000 would likely invite momentum continuation, whereas repeated failures at this level could produce consolidation or a modest retracement toward the 20-day SMA before buyers reassess.
Contextually, the week-over-week advance of roughly +721 points (derived from the reported +1.625% change) reflects steady broad buying rather than a capitulative squeeze. The distribution of gains—combined with momentum readings that are constructive but not extreme—suggests the market may prefer a glide path higher, punctuated by minor dips, rather than a parabolic move. In this environment, the most informative tells into next week should be: whether pullbacks stall near the 20-day SMA (bullish), and whether any failed attempts at 45,000 attract immediate sellers (neutral to bearish).
In trend classification terms, the Dow maintains a short-term bullish bias above the 20-day SMA and a more durable constructive bias above the 50-day SMA. However, without the 200-day SMA or broader breadth data in this snapshot, we refrain from making claims about longer-term trend regimes. The available evidence supports a near-term bullish lean with identifiable invalidation points below.
Detailed Technicals
Price Action vs. Short-Term Averages
Price closed at 44,911.26, placing it:
- Approximately 495.50 points (about 1.12%) above the 20-day SMA at 44,415.76.
- Approximately 1,077.13 points (about 2.46%) above the 50-day SMA at 43,834.13.
This configuration—price above both the 20- and 50-day moving averages—supports a constructive near-term trend profile. The modest spread to the 20-day average implies that a typical pullback could test the 44,300–44,450 zone without breaking the trend. The wider cushion to the 50-day SMA offers a secondary layer of support, indicating that the market would need a decidedly risk-off impulse to threaten the intermediate uptrend.
Into 45,000, which lies roughly 89 points above the last close, microstructure often becomes more tactical: intraday tests can fail on the first attempt as supply surfaces. If buyers can sustain trade above 45,000 and convert that level into support on retests, it would validate the existing momentum and potentially open the path toward progressively higher psychological waypoints (e.g., 45,500 and 46,000). Conversely, early-week failure below 45,000 paired with a daily close under the 20-day SMA would caution that a deeper test toward the 50-day may be forming.
RSI(14): Balanced Momentum with a Bullish Tilt
The 14-day RSI at approximately 60.04 sits comfortably above the neutral 50 line but well short of the overbought threshold (70). This reading indicates that buying pressure has the upper hand without showing signs of exhaustion. In practical terms:
- An RSI hold in the 55–65 band tends to accompany trend continuation with shallow, buyable dips.
- A decisive push above 65 would indicate strengthening momentum and raise odds of a sustained breakout through 45,000.
- A dip below 50 would warn that buyers are losing control, elevating the risk of a test of the 50-day SMA.
Given the present 60-handle, momentum conditions favor buying on weakness rather than chasing strength, unless a breakout above the psychological 45,000 is confirmed with expanding breadth and follow-through.
MACD (12/26/9): Positive and Widening vs. Signal
The MACD line at 172.74 exceeds its signal line at 163.62, leaving a positive histogram of approximately +9.12. This profile suggests that trend strength is improving at the margin. Key takeaways:
- MACD above signal is typically consistent with a short-term uptrend; the positive histogram quantifies the degree of momentum.
- A further widening of the MACD-signal spread would corroborate a breakout through 45,000.
- A bearish cross (MACD falling below signal) would be an early warning that upside momentum is fading; if such a cross coincides with price slipping under the 20-day SMA, the probability of a deeper drawdown rises.
In isolation, the current MACD stance supports the case for trend continuation, but as always, confirmation from price levels (especially 45,000) and RSI behavior (maintaining above 50–55) will matter.
Key Levels (Support/Resistance)
With limited historical context in the snapshot, we anchor levels to provided moving averages, the last close, a derived prior-week close estimate, and nearby psychological round numbers. Treat these as zones rather than exact ticks.
| Type | Level | Rationale |
|---|---|---|
| Resistance (R1) | 45,000 | Psychological round number directly overhead; common reaction area. |
| Resistance (R2) | 45,500 | Next psychological waypoint if 45,000 breaks and holds. |
| Resistance (R3) | 46,000 | Larger psychological figure; potential upside magnet on sustained momentum. |
| Reference | 44,911.26 | Last close; pivot for early-week tone. |
| Support (S1) | 44,415.76 | 20-day SMA; first tactical support where buyers may defend. |
| Support (S2) | ~44,190 | Approximate prior-week close based on the reported +1.625% gain; potential reaction zone. |
| Support (S3) | 43,834.13 | 50-day SMA; key intermediate support that defines the constructive bias. |
| Support (S4) | 43,000 | Broader psychological level; a deeper risk-off line in the sand if momentum deteriorates. |
Scenario Analysis: Next-Week Paths and Price Projections
Below are three forward-looking scenarios framed by the current technicals. These are not predictions but structured paths with triggers and approximate ranges.
Bullish Scenario (Break-and-Hold Above 45,000)
- Trigger: Firm break above 45,000 with a daily close north of that level, followed by intraday retests that hold.
- Momentum Context: RSI pushes toward 63–66; MACD histogram widens further positive.
- Price Projection (next week): 45,200–46,000.
- Invalidation: A failed breakout that settles back below 44,900 and especially below the 20-day SMA (~44,416) would fade this scenario.
Rationale: With price already above the 20- and 50-day SMAs and RSI near 60, incremental momentum could be enough to crack 45,000. If that level converts to support, round-number magnetism and positive MACD may carry the index higher. The 45,500 waypoint and then 46,000 are logical increments.
Bearish Scenario (Failure at 45,000, Momentum Rolls Over)
- Trigger: Repeated rejections at 45,000 followed by a daily close below the 20-day SMA (~44,416).
- Momentum Context: RSI slips back under 50–52; MACD flattens and crosses below its signal.
- Price Projection (next week): 43,600–44,400, with risk of an extension toward the 50-day SMA (~43,834) if sellers press.
- Invalidation: A decisive daily close back above 45,000 would neutralize the bearish path.
Rationale: The 20-day SMA is a first line of defense. Losing it would signal that buyers are no longer defending shallow dips, increasing the odds of a mean-reversion move toward the 50-day SMA. A MACD bear cross would add confirmation to downside risks.
Most-Likely Scenario (Range-Bound With Bullish Bias)
- Trigger: Early-week probing of 45,000 without follow-through, but with dips finding support at or above the 20-day SMA.
- Momentum Context: RSI chops between 55 and 62; MACD remains positive but does not materially expand.
- Price Projection (next week): 44,300–45,300.
- Invalidation: A clean breakout and hold above 45,000 transitions into the bullish scenario; a daily close below ~44,400 transitions into the bearish scenario.
Rationale: Given the moderate distance to the 20-day SMA and the lack of overbought signals, the path of least resistance may be a controlled range with a bullish lean, allowing the market to build energy for a more directional move later.
Comparative Outlook: How Our View Compares With External Signals
We benchmark our interpretation against three external technical snapshots to contextualize alignment and divergences.
1) Investing.com – Dow Jones Industrial Average Technicals
Source: https://www.investing.com/indices/us-30-technical
“Summary: Strong Sell. Moving Averages: Strong Sell. Technical Indicators: Strong Sell.”
Commentary: This starkly contrasts with our data-driven snapshot, which shows price above both the 20- and 50-day SMAs, RSI around 60, and a positive MACD histogram—all of which are typically not “Strong Sell” conditions on a daily basis. The discrepancy likely reflects differences in timeframe or aggregation methodology. Investing.com’s composite can be heavily influenced by shorter intraday horizons or specific oscillator weightings that are not captured in our provided snapshot. Based solely on the given metrics, our near-term read is cautiously bullish, not strongly bearish.
2) Investing.com – Dow Jones 30 Futures Technicals
Source: https://www.investing.com/indices/us-30-futures-technical
“Summary: Strong Sell. Moving Averages: Strong Sell. Technical Indicators: Strong Sell.”
Commentary: Futures-based dashboards often update on a different cadence and may reflect intraday volatility or overnight risk sentiment. Again, this “Strong Sell” read diverges from the snapshot we have, where the Dow cash index sits above SMA20/50 with constructive momentum. Our interpretation remains that, on a daily basis, conditions appear more balanced-to-bullish than uniformly bearish. The key to reconciling these views would be timeframe alignment: if the external summaries emphasize very short-term negative swings, they can coexist with an intact daily up-bias.
3) FXStreet – Dow Jones Elliott Wave Technical Analysis (Video)
Source: https://www.fxstreet.com/news/dow-jones-dji-elliott-wave-technical-analysis-video-202506161224
“Function: Bullish Trend. Mode: Impulsive.”
Commentary: This characterization aligns more closely with our snapshot. While we do not employ Elliott Wave labeling here, the notion of an impulsive bullish mode is consistent with price being above SMA20/50 and momentum gauges leaning positive. The emphasis in our framework is less on wave count and more on definable risk markers (e.g., SMA20/SMA50, 45,000). Both approaches, however, point to a market where buyers currently have the advantage, barring a reversal in momentum.
Risk Factors & What Could Invalidate The Setups
Several conditions could undermine the constructive technicals or, conversely, catalyze a stronger advance. Monitoring these will help calibrate risk and adapt positioning:
- Loss of the 20-day SMA (~44,416): A daily close below the 20-day would be the first credible warning that dip-buyers are stepping back. If followed by weak retests (failing to reclaim), it would elevate the risk of a move toward the 50-day SMA.
- MACD Bearish Cross: Should MACD roll below its signal line while price is failing at 45,000, downside momentum could accelerate. This signal often precedes or accompanies deeper pullbacks.
- RSI Slipping Below 50: Momentum turning neutral-to-negative would corroborate the bearish scenario. Sustained sub-50 RSI typically aligns with sellers gaining control of the tape.
- Breakdown Below the 50-day SMA (~43,834): This would invalidate the intermediate-term constructive bias and shift the outlook to defensive until reclaimed.
- Volatility Shocks or Macro Surprises: Unexpected macroeconomic data, policy communications, or exogenous shocks can overwhelm technical setups. While not contained in the snapshot, these catalysts can swiftly push price through technical levels, creating gaps and slippage.
On the other side, what could strengthen the bullish picture?
- Strong Hold Above 45,000: Converting 45,000 from resistance to support on a closing basis and holding it on retests would validate the breakout and likely extend the advance toward 45,500–46,000.
- Momentum Expansion: RSI pressing into the mid-to-high 60s with a widening positive MACD histogram would signal trend acceleration rather than mere drift.
In practical risk management terms, the 20-day SMA is the tactical pivot for short-term bias, and the 50-day SMA is the structural pivot for the intermediate trend within the frame of this snapshot.
Editorial Statement (Disclaimer)
This commentary is a technical analysis based solely on the provided snapshot metrics (price, SMA20/50, RSI14, MACD 12/26/9, weekly change) and three external references quoted above. It is intended for informational and educational purposes and does not constitute investment advice, a solicitation, or a recommendation to buy or sell any security or index. Markets are uncertain, and technical patterns can fail. Always perform your own due diligence and consider consulting a qualified financial professional before making trading or investment decisions. Past performance and historical technical behaviors are not indicative of future results. Use risk controls appropriate to your objectives, time horizon, and tolerance.
Appendix: Calculations and Interpretive Notes
- Weekly change: +1.625% over the last 7-day window from the provided dataset. Backing into an approximate prior-week close yields roughly 44,190, implying an estimated ~+721-point weekly gain to the reported 44,911.26 last close.
- Distance to moving averages: Price is ~495.50 points above SMA20 (~1.12%) and ~1,077.13 points above SMA50 (~2.46%).
- RSI(14): 60.041… rounded here to ~60.0 for interpretation; overbought typically begins near 70 in classical frameworks.
- MACD(12/26/9) vs. Signal: 172.7369 vs. 163.6173; histogram ~+9.12. A positive histogram denotes the MACD line above its signal line, reflecting positive momentum.
These calculations guide our scenario thresholds and the emphasis on the 20-day and 50-day moving averages as tactical and structural pivots, respectively.