S&P 500 (^GSPC) Weekly Technical Analysis:
Executive Summary
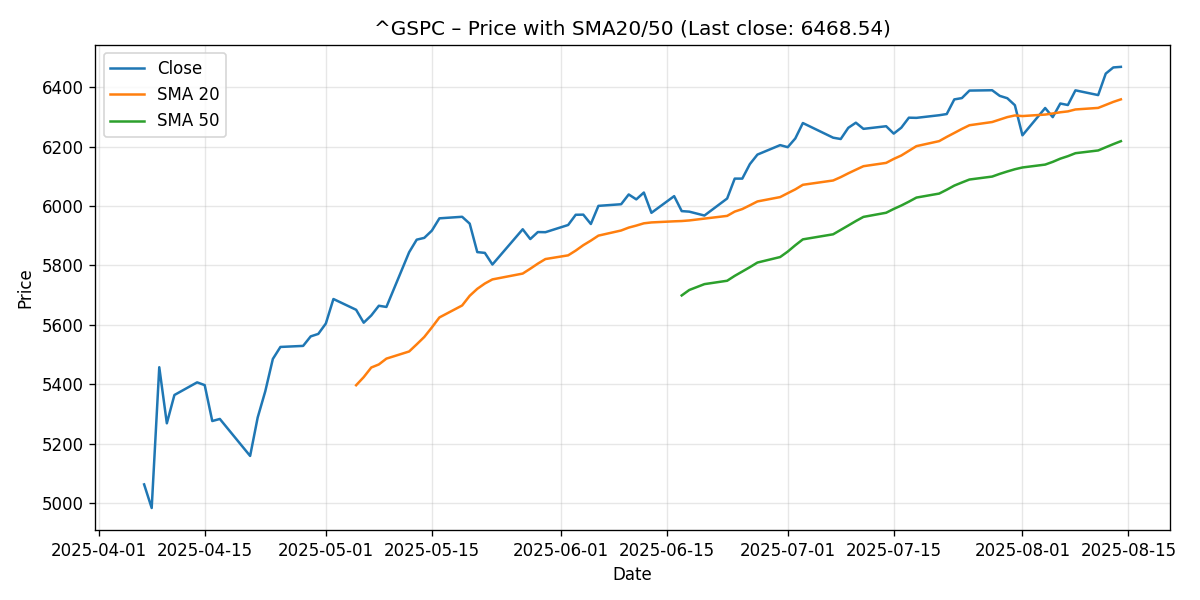
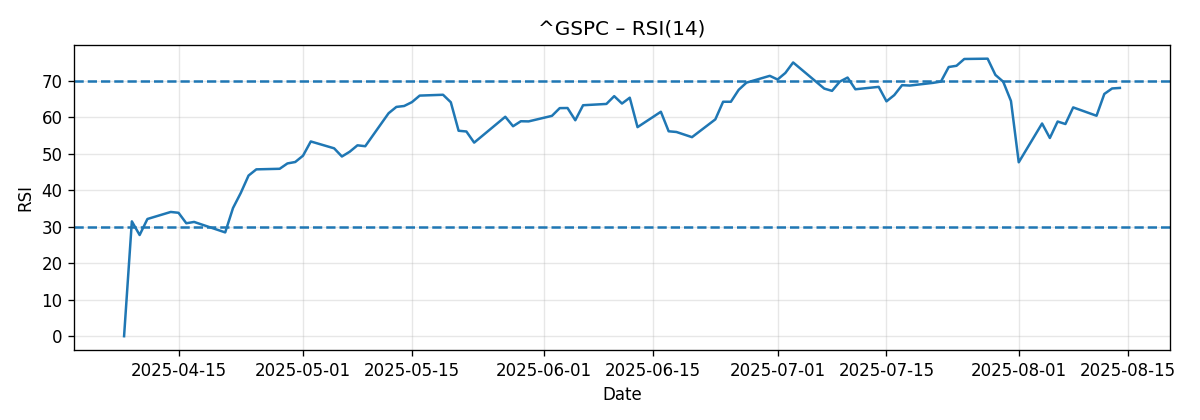
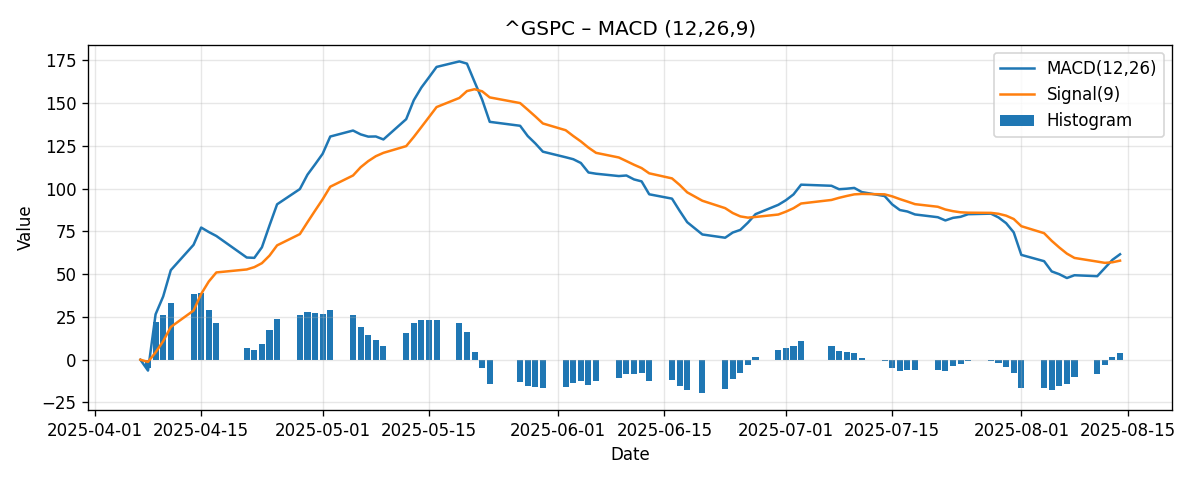
The S&P 500 (^GSPC) closed the week at 6,468.54, advancing approximately 1.95% week over week based on the supplied seven-day window. Technically, the index ends the period on firm footing: price is above both the 20-day simple moving average (SMA20 at 6,359.09) and the 50-day simple moving average (SMA50 at 6,218.23), with momentum indicators skewed bullish. The 14-day Relative Strength Index (RSI14) prints at 68.00, placing the gauge just shy of the common overbought threshold at 70. The MACD (12/26/9) remains positive at 61.68, with the signal line at 57.94, yielding a positive histogram of roughly +3.74. Collectively, this setup indicates constructive near-term momentum tempered by the possibility of short-term overextension.
From a levels perspective, 6,500 emerges as an important psychological waypoint and a level that external commentary has highlighted as a potential springboard. The nearby year-end target discourse around 6,600 (per several strategists cited in mainstream outlets) also frames the overhead region between 6,500 and 6,600 as a band where price discovery may continue next week. On the downside, the SMA20 (6,359) and the round-number shelf near 6,400 represent first-line supports; the SMA50 (6,218) is a deeper reference that would only likely come into play if momentum fades more decisively.
Our base case for the coming week is a consolidation with an upward bias, anchored by sustained closes above 6,400 and the SMA20. A breakout above 6,500 that holds could invite a push into 6,550–6,620, while failure to hold 6,400 would open room to mean-revert toward the 6,359 SMA20 and potentially probe 6,300–6,340. These tactical views are strictly informed by the provided technical snapshot and three external viewpoints summarized below, and they do not incorporate unprovided macro catalysts or fundamental data.
Weekly Market Context & Trend
Over the latest seven-day window, the S&P 500 gained about 1.95%. This performance is consistent with a market leaning into strength: it comes with price perched above both the SMA20 and SMA50. The positive gap between spot and these moving averages adds evidence to a prevailing short-term uptrend.
Key relational metrics at this close:
- Price vs. SMA20: 6,468.54 is approximately 109.45 points above the 6,359.09 SMA20, a premium of roughly 1.69% versus price (about 1.72% relative to the SMA20 base).
- Price vs. SMA50: 6,468.54 is approximately 250.31 points above the 6,218.23 SMA50, a premium of roughly 3.87% versus price (about 4.03% relative to the SMA50 base).
- RSI14: 68.00, which is near but below the 70 overbought threshold—often a region where momentum can persist, but where short, sharp reversions also become more probable.
- MACD (12/26/9): Line at 61.68, signal at 57.94, histogram near +3.74—indicating bullish momentum and a positive crossover state.
Stepping back, the market’s location relative to 6,500 is important for psychology and for short-dated positioning. Round-number levels often concentrate orders and attention, and here that is complemented by external narratives positioning 6,500–6,600 as a consequential zone. If the index can steady above 6,500, the primed momentum profile (RSI just under 70, MACD positive) suggests the path of least resistance could remain to the upside. Conversely, being this close to overbought on RSI means a modest cooling—or an intraday reversal from 6,500—would not be a surprise and could simply represent healthy digestion of gains rather than a trend change.
In short, trend signals skew bullish, but the proximity to round-number resistance and an elevated RSI argue for tactical respect of both upside continuation risk and downside mean-reversion risk in the very near term.
Detailed Technicals (Price, SMA20/50, RSI14, MACD 12/26/9)
Price Structure and Moving Averages
The S&P 500 closed at 6,468.54, above the SMA20 (6,359.09) and SMA50 (6,218.23). When price resides above both these averages, it typically points to a market with positive short- to intermediate-term momentum. The distance to each moving average offers risk markers:
- Distance to SMA20: Approximately 109.45 points. A pullback of that size would place price near 6,359, which often acts as first support in uptrends. A routine retest is neither unusual nor necessarily bearish if buyers defend it.
- Distance to SMA50: Approximately 250.31 points. A drift to the 50-day is more consequential and, if tested, would invite a reevaluation of the momentum profile. It is also a common reversion zone in trending markets when momentum cools.
With the market up ~1.95% on the week and sitting roughly 0.5% below the 6,500 round number, the tape is set for an inflection attempt. Sustained acceptance above 6,500 would shift market psychology and potentially draw in incremental momentum flows. But until that level is converted and held on closing bases, it remains a near-term ceiling.
What would constitute a deterioration in the price/MA setup? A daily close below the SMA20 followed by failed reclaims and lower highs would be an early caution. A subsequent failure of the 6,300–6,340 region and a test of the SMA50 near 6,218 would confirm momentum degradation. None of this is currently in place; it is merely the downside roadmap.
RSI14 (Momentum)
The RSI14 sits at 68.00. In classic momentum terms:
- Above 70 is commonly labeled overbought.
- Between 50 and 70 is generally bullish, reflecting positive momentum.
- Below 50 would indicate waning momentum; below 30 is oversold.
At 68, RSI is bullish and nearing overbought territory. Importantly, an RSI print in the high 60s does not compel immediate weakness; in strong trends, RSI can spend extended periods hovering near or even above 70. However, as RSI approaches 70, the probability of short-term pullbacks increases because many tactical traders fade initial overbought readings, at least for short-term mean reversion attempts. Thus, watch for how RSI behaves on attempts through 6,500: if price breaks 6,500 but RSI fails to eclipse 70 or quickly retreats from an overbought print, that could hint at a near-term consolidation or a pause. Conversely, a sustained RSI move into the 70–75 zone accompanied by higher price highs would signal persistent momentum and a higher likelihood of continuation.
Given the current reading, the balance of evidence suggests a market with positive thrust but susceptible to two-way action around key resistance. Tactical positioning should anticipate both a potential breakout and a quick fade scenario at 6,500, with RSI serving as a useful confirmation filter.
MACD (12/26/9)
The MACD line is 61.68, the signal line is 57.94, and the histogram is positive at roughly +3.74. A positive histogram reflects that the MACD line is above its signal line and that the drifts of the faster and slower EMAs inside the calculation remain in favor of bulls. While the absolute values are index-point constructs rather than percentages, the directional message is straightforward: momentum is currently supportive of higher prices.
Near-term, a few confirmation cues matter:
- If price pushes and holds above 6,500 and the MACD histogram expands further, that would corroborate a momentum-led breakout.
- If the index stalls at 6,500 and the histogram compresses toward zero (or if MACD crosses below the signal), that would validate a consolidation or a deeper retracement toward the SMA20 region.
Presently, with MACD positive and the histogram above zero, the onus is on sellers to reclaim control. Until then, trend-followers will typically give the benefit of the doubt to the upside, especially while price remains above the SMA20.
Key Levels (Support and Resistance)
Below is a consolidated table of nearby supports and resistances derived from the provided technicals and round-number psychology:
| Level | Type | Rationale |
|---|---|---|
| 6,600 | Resistance | Round number overhead; also a cited year-end target in external commentary. |
| 6,500 | Resistance / Potential Pivot | Psychological round number; highlighted externally as a potential “launching pad” zone. |
| 6,468.54 | Reference (Close) | Current close; intraworking pivot for breakout or mean reversion attempts. |
| 6,400 | Support | Round-number shelf; first support on modest pullbacks toward SMA20. |
| 6,359 | Support | SMA20; first moving-average support in the current uptrend. |
| 6,300 | Support | Round number; below SMA20, relevant on deeper retracements. |
| 6,218 | Support | SMA50; important intermediate-term trend reference. |
Breaks and holds relative to these levels will shape the tactical path in the coming sessions. The closer the level is to the current price, the more likely it is to be tested next week; hence 6,500, 6,400, and 6,359 (SMA20) are especially relevant.
Scenario Analysis (Bullish / Bearish / Most-Likely)
Given the present technical configuration and the week’s performance, we outline three tactical paths for next week with numeric ranges. These are scenarios, not certainties, and they flow directly from the current price/indicator posture and the provided external viewpoints.
Bullish Scenario
- Trigger: A decisive push through 6,500 accompanied by sustained closes above that level, with RSI pressing through 70 and MACD histogram expanding.
- Projection: 6,550 to 6,620 next week. This aligns with the idea of 6,500 as a springboard and acknowledges the nearby external focus on 6,600.
- Invalidation: A failed breakout where price rejects 6,500 and closes back below 6,440–6,450, or RSI fails at/near 70 and rolls over while MACD compresses toward zero.
Bearish Scenario
- Trigger: A daily close below 6,400, followed by a probe of the SMA20 at 6,359 that fails to hold on a retest.
- Projection: 6,300 to 6,340 next week, with extension risk to 6,250 if momentum erodes quickly. A deeper test toward the SMA50 (6,218) would require more persistent selling pressure than currently evident.
- Invalidation: Reclaiming and holding above 6,450 after the breakdown attempt, alongside stabilizing RSI (back into mid-60s) and a MACD histogram that refuses to turn negative.
Most-Likely (Base Case) Scenario
- Setup: Consolidation with an upward bias, where price oscillates between supports near 6,400–6,360 (SMA20) and resistances near 6,500–6,550.
- Projection: 6,385 to 6,550 range for the week, with an upside skew if 6,500 turns into support midweek. Absent a strong catalyst, buyers and sellers may engage in two-way trade as momentum indicators hover near their current levels.
- Key Tells: Whether RSI sustains above 60 on dips and whether MACD remains positive. Both would favor dip-buying and higher-lows behavior within the stated range.
These ranges reflect the immediate technical push-and-pull: bullish momentum is real (RSI near 70, MACD positive), but it is running into a well-watched round-number zone. That recipe often yields a week or two of stair-step price action unless and until a clean breakout occurs.
Comparative Outlook: Three External Predictions
To frame our technical view within broader market commentary, we consider three externally sourced viewpoints and discuss alignment or divergence relative to our next-week outlook.
1) Citigroup/UBS lift S&P 500 targets (Reuters)
Source: Reuters.
Quoted view: “Citi bumped the benchmark index’s target to 6,600 from 6,300.”
Interpretation: This is a year-end framing rather than a next-week call, but it is relevant because it concentrates attention around 6,600 as a destination. Technically, with the index at 6,468.54, 6,600 sits ~2.0% above. Our bullish scenario range (6,550–6,620) acknowledges the possibility that the market attempts to press toward this area as early as next week—conditional on converting 6,500 into support. Where we differ is time horizon: the Reuters piece relays strategic targets into year-end, while our analysis is explicitly tactical, focusing on the microstructure around 6,500 and the role of RSI/MACD in determining whether 6,600 is reachable in the immediate term.
2) 6,500 as a “launching pad” (MarketWatch)
Source: MarketWatch.
Quoted view: “6,500 can be a launching pad for the S&P 500.”
Interpretation: This aligns closely with our technical map. The market sits just shy of 6,500, and both the RSI (68) and MACD (positive with a +3.74 histogram) support the notion that, if 6,500 is absorbed, momentum can carry further. Our bullish scenario directly reflects this, projecting 6,550–6,620 if acceptance above 6,500 materializes. Where we add nuance is in the risk guardrails: an RSI rejection near 70 or a contracting MACD histogram on the approach would warn that the “launch” may be delayed by consolidation first.
3) Expectation of a 14% pullback before end-2025 (MarketWatch)
Source: MarketWatch.
Quoted view: “Bannister projects the S&P 500 could dip to around 5,500.”
Interpretation: This perspective speaks to a more extended horizon, raising the possibility of a sizable corrective phase before the end of 2025. From a purely technical standpoint using our provided snapshot, there is no active signal that such a move is imminent next week: price is above SMA20 and SMA50, RSI is in bullish territory, and MACD is positive. However, we acknowledge that markets can and do shift. Our bearish scenario outlines a path toward 6,300–6,340 if near-term supports give way, but that is far from the 5,500 zone. In short, our next-week view diverges from the magnitude of the longer-horizon bearish call—not by disputing it on fundamentals (which we are not analyzing here), but because the provided near-term technicals are not currently aligned with such a deep drawdown.
Risk Factors & What Could Invalidate The Setups
Even in a momentum-supported market, near-term risks can quickly skew outcomes. The following items would invalidate or materially alter our scenarios, strictly through a technical lens:
- Failed Breakout at 6,500: Multiple intraday probes above 6,500 that repeatedly fail, followed by a close below 6,440–6,450, would signal resistance is asserting itself. If this coincides with RSI stalling under 70 and MACD histogram contraction, the bullish scenario weakens and the base case shifts toward consolidation or a pullback to 6,359 (SMA20).
- Loss of SMA20 (6,359): A decisive close below the SMA20, followed by a failed reclaim, would mark a meaningful change in near-term character. This would point to increased probability of testing 6,300 and possibly 6,250. In that environment, MACD turning negative (line under signal) would be an additional warning flag.
- Sharp Momentum Reversal in RSI and MACD: If RSI drops below 50 on a selloff while MACD crosses beneath the signal line, the market loses its momentum edge. The risk would rise for a deeper retracement toward the SMA50 (6,218).
- Round-Number Gaps: Slippage around 6,400 and 6,500 is common when liquidity is clustered. Rapid moves through these levels can trigger short-term whipsaws that temporarily invalidate intraday signals. Confirmation via closing prices is important in such cases.
Importantly, none of these risk dynamics are currently active in the data provided; they are contingency frameworks should price action deteriorate or stall at key thresholds.
Putting It All Together: A Structured Game Plan
- Above 6,500 with RSI >= 70 and expanding MACD histogram: Favor continuation toward 6,550–6,620.
- Chop below 6,500 but above 6,400: Expect range-bound trade 6,385–6,550 with tactical fades of extremes.
- Loss of 6,400 and then 6,359 (SMA20): Prepare for 6,300–6,340, with 6,250 as risk if momentum damages deepen.
- Deep downside only becomes a higher-likelihood discussion on a break/hold below the SMA50 (6,218) coupled with negative momentum reads. That is currently a low-probability path based on the provided snapshot.
Indicator Snapshot Summary
- Close: 6,468.54
- Week-over-week change: +1.95%
- SMA20: 6,359.09 (price above by ~109.45 pts; ~1.69% vs price)
- SMA50: 6,218.23 (price above by ~250.31 pts; ~3.87% vs price)
- RSI14: 68.00 (bullish momentum; near overbought)
- MACD 12/26/9: 61.68 vs signal 57.94; histogram ~+3.74 (bullish)
Why Our View Differs or Aligns With External Commentary
Our approach is tightly anchored in the provided technical snapshot and is tactical over a one-week horizon, whereas much of the external commentary speaks to year-end or multi-quarter lines of travel. Thus:
- We align with the idea that 6,500–6,600 is an important zone (as seen in both the Reuters target upgrade narrative and the “launching pad” note). Our bullish scenario simply compresses the timeline: it is contingent on a near-term technical breakout rather than a calendar-driven target.
- We differ from the deep pullback projection (~5,500) not by fundamentally refuting the argument, but because the technicals at this moment (price above SMA20/50, RSI near 70, positive MACD) do not foreshadow such a move next week. We treat that bear case as a risk to monitor over longer horizons, not a base case for the immediate term.
Practical Checkpoints for the Coming Week
To keep this analysis actionable within a purely technical framework, here are the key checkpoints to monitor:
- 6,500 Handling: Does the market print a daily close above 6,500? If yes, how do RSI and MACD behave in the subsequent session?
- SMA20 Defense: If 6,400 gives way intraday, do buyers defend 6,359 into the close? A firm defense maintains the bullish structure.
- Momentum Consistency: Does RSI hold above 60 on dips? Does MACD avoid a bearish crossover? If so, dips likely remain buyable.
- Range Expansion/Compression: If realized ranges expand above 6,500, upside targets near 6,600 come into play; if ranges compress between 6,400 and 6,500, expect chop before direction resolves.
Editorial Statement
This report is a technical analysis of ^GSPC based solely on the supplied snapshot (price, SMA20, SMA50, RSI14, MACD) and three external articles linked above. It does not incorporate or infer any additional data, events, or fundamentals beyond those sources. The scenarios and levels discussed are for informational and educational purposes and are not investment advice, recommendations, or solicitations to buy or sell any security or index. Markets are uncertain and can move rapidly in response to new information. Use multiple sources and your own judgment before making decisions, and consider consulting a qualified financial professional to assess strategies appropriate for your objectives and risk tolerance.
In brief: momentum currently favors the bulls, but the market is arriving at a widely watched round-number zone with an RSI near overbought. That combination often produces either a clean breakout or a period of consolidation. Next week’s story will likely be written by how the S&P 500 behaves around 6,500 and whether RSI and MACD confirm or fade the move.